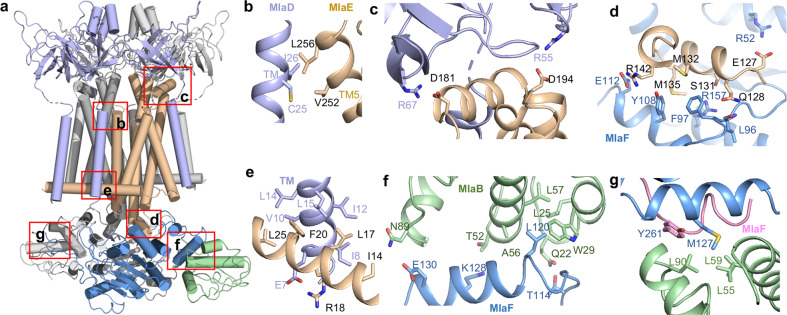
Fig. 3. Interactions of individual subunits in MlaFEDB.
a Overall cylindrical helix cartoon view of MlaFEDB, the interactions of individual subunits are boxed in red. b Zoomed-in view of the interaction between TMD2 of MlaD (light blue) and TM5 of MlaE (wheat). c Zoomed-in view of the interaction between MCE domain of MlaD (light blue) and the PH of MlaE (wheat). d Zoomed-in view of the interaction between the CH of MlaE (wheat) and MlaF (actinium). e Zoomed-in view of the interaction between TMD2 of MlaD (light blue) and the EH of MlaE (wheat). f Zoomed-in view of interaction of MlaB (pale green) and one MlaF subunit (actinium). g Zoomed-in view of interaction of MlaB′ (pale green) and two MlaF subunits (MlaF, pink; MlaF′, actinium).

