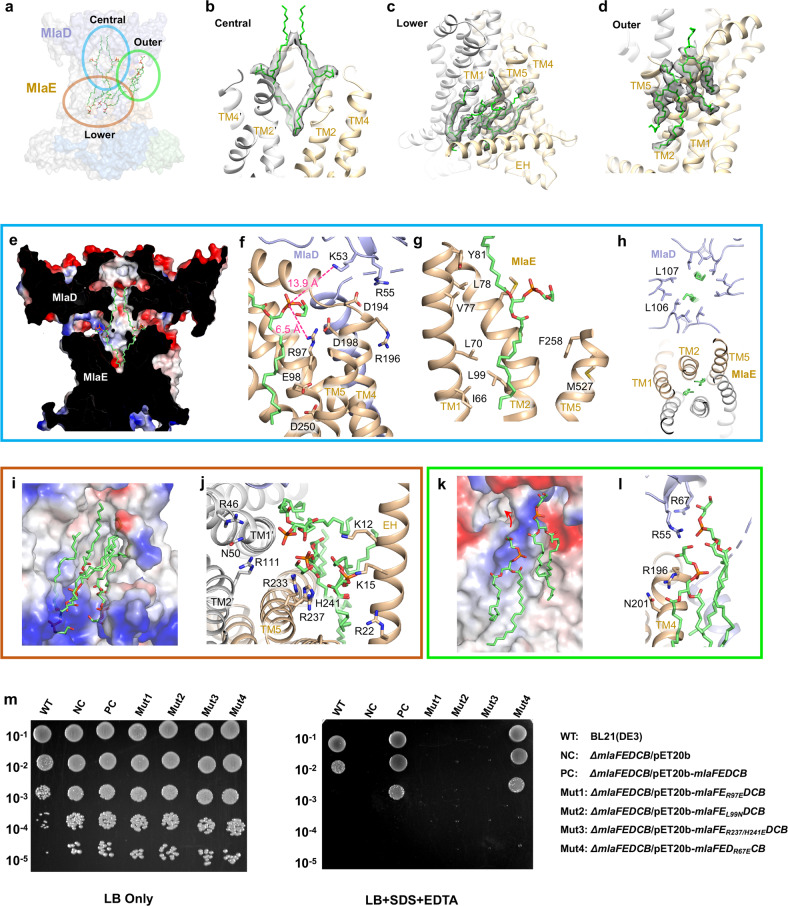
Fig. 4. Interactions between phospholipids and MlaFEDB.
a Overall view of all the phospholipids bound in the center, lower-side and outer-side cavities of MlaFEDB. The lipids bound in the cavity are circled in blue, orange and green, respectively. Zoomed-in views of the circled regions are shown in b–d, and the colored boxes in e–l correspond to the zoom-ins shown in b–d. b–d Zoom-in views of the phospholipid bound in the center, lower-side and outer-side cavities in MlaFEDB. Cryo-EM densities are shown superimposed with the atomic model of phospholipids. e Cross-sectional view of the electrostatic surface of the central cavity. f–h Zoomed-in view of detailed interactions between the phospholipids with MlaD and MlaE. Positively charged and negative charged regions are shown in blue and red, respectively. Phospholipids are shown as green sticks. MlaD and MlaE are shown in light blue and wheat, respectively. i Cross-sectional view of the electrostatic surface of the lower-side cavity. j Zoomed-in view of detailed interactions between the phospholipids and TMs of MlaD (gray) and MlaE (wheat). k Cross-sectional view of the electrostatic surface of the outer-side cavity. l Zoomed-in view of detailed interactions between the phospholipids with the MCE domain of MlaD (gray) and TM4 of MlaE (wheat). m Complementation of MlaFEDCB mutants in MlaFEDCB deletion strain.

