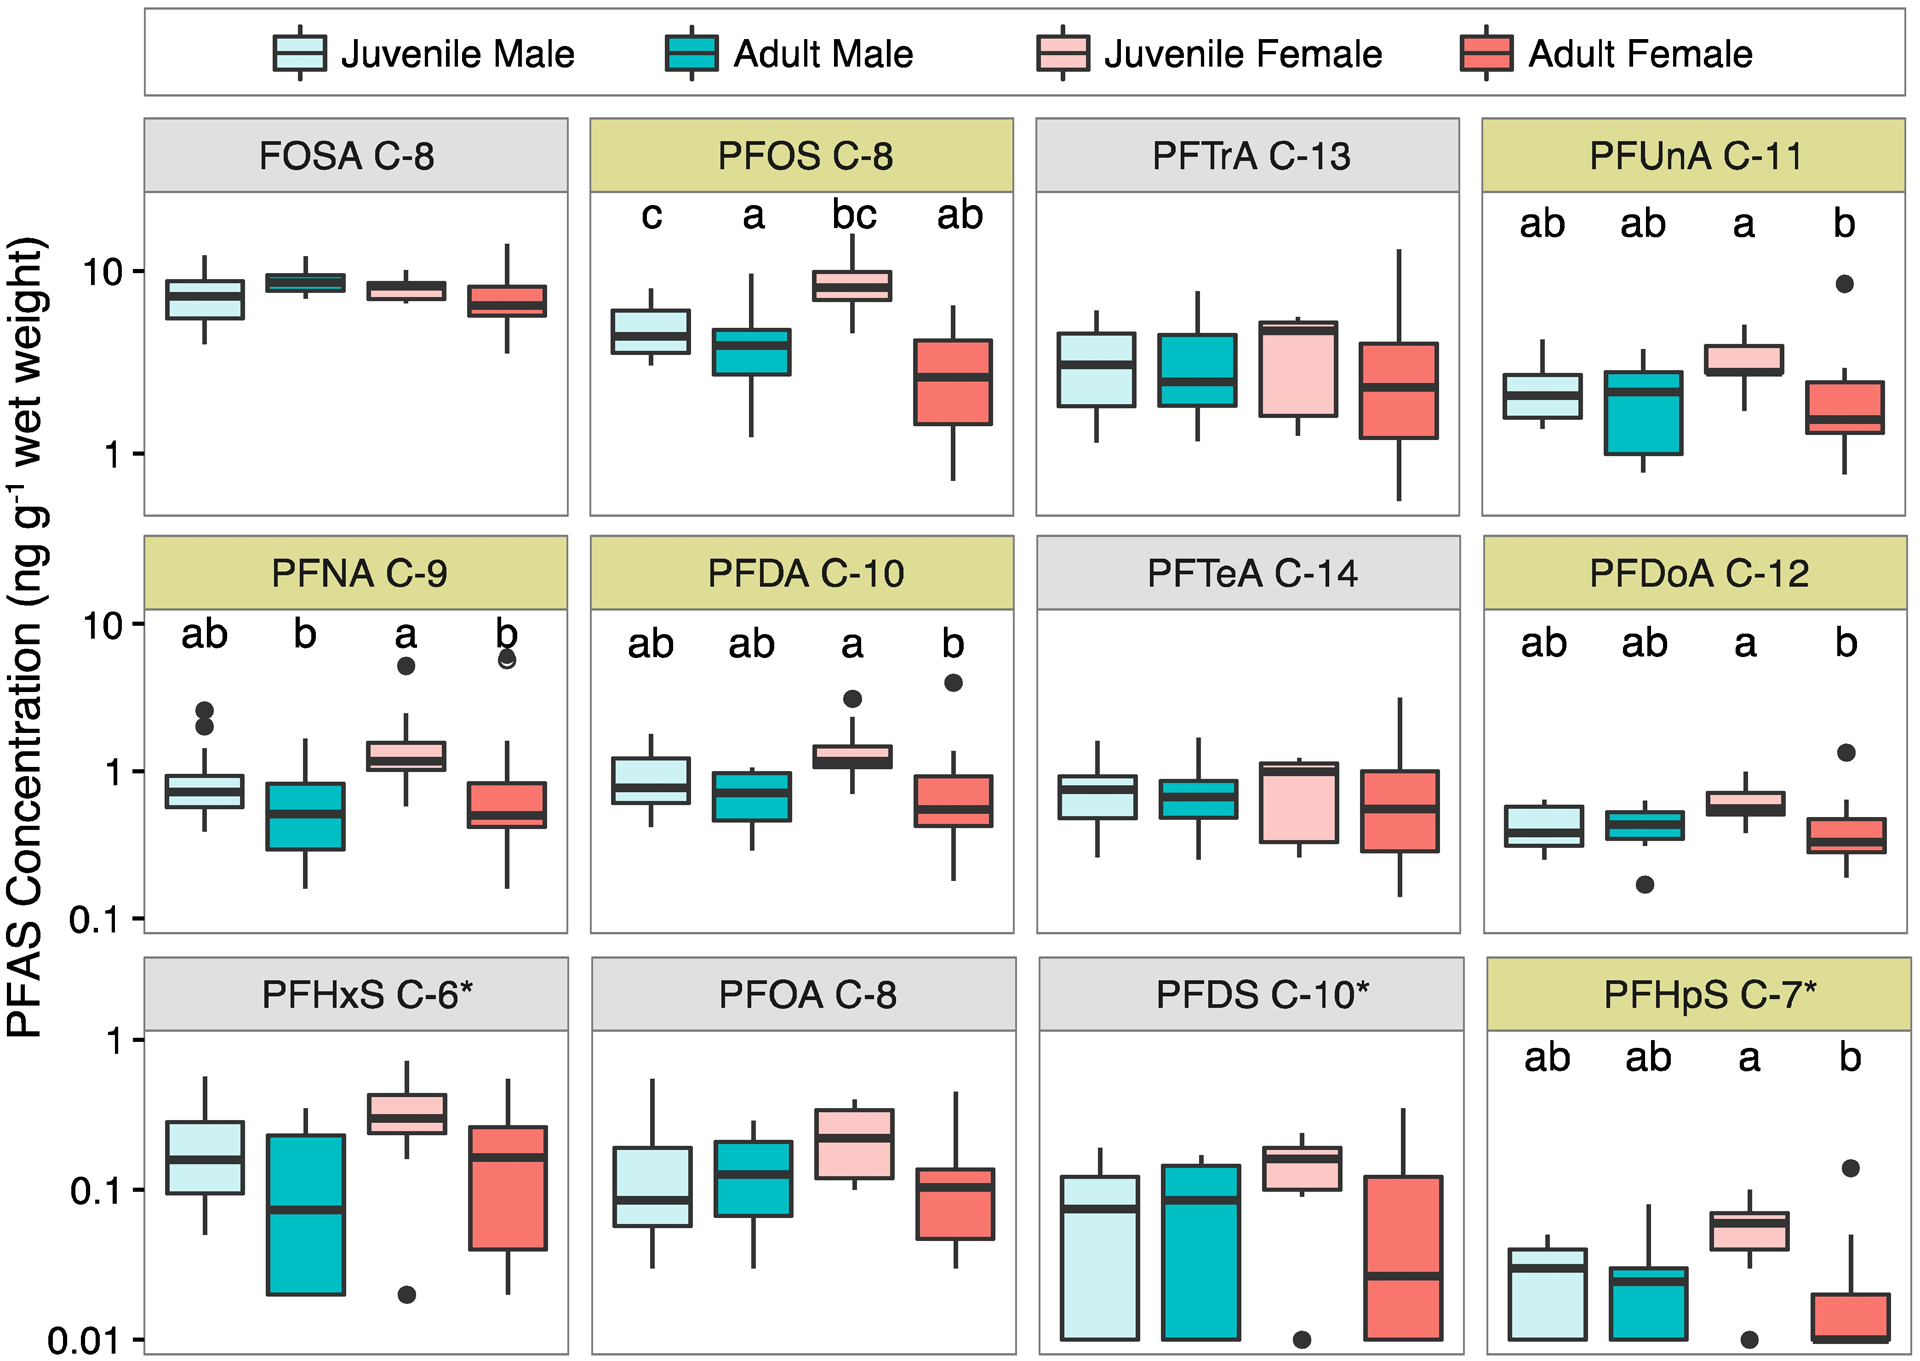
Figure 1.

Effects of life stage and gender on measured PFAS concentrations in pilot whale muscle (Globicephala melas) sampled in 2013. Median concentrations for each group are represented by the horizontal black line in box/whisker plots. Notches represent 25th and 75th percentile concentrations, whiskers extend to 1.5 times the interquartile range and outliers are shown as circles. Compounds that differ significantly between groups based on one-way ANOVA (p < 0.05) are shaded yellow, and common letters above each box indicate groups with no significant difference in between group comparisons in post hoc analysis using Tukey’s test. Compounds from Table 1 that are not shown here were infrequently detected. For compounds denoted by ‘*’ non-detects are shown as the detection limit multiplied by 1/√2.46
