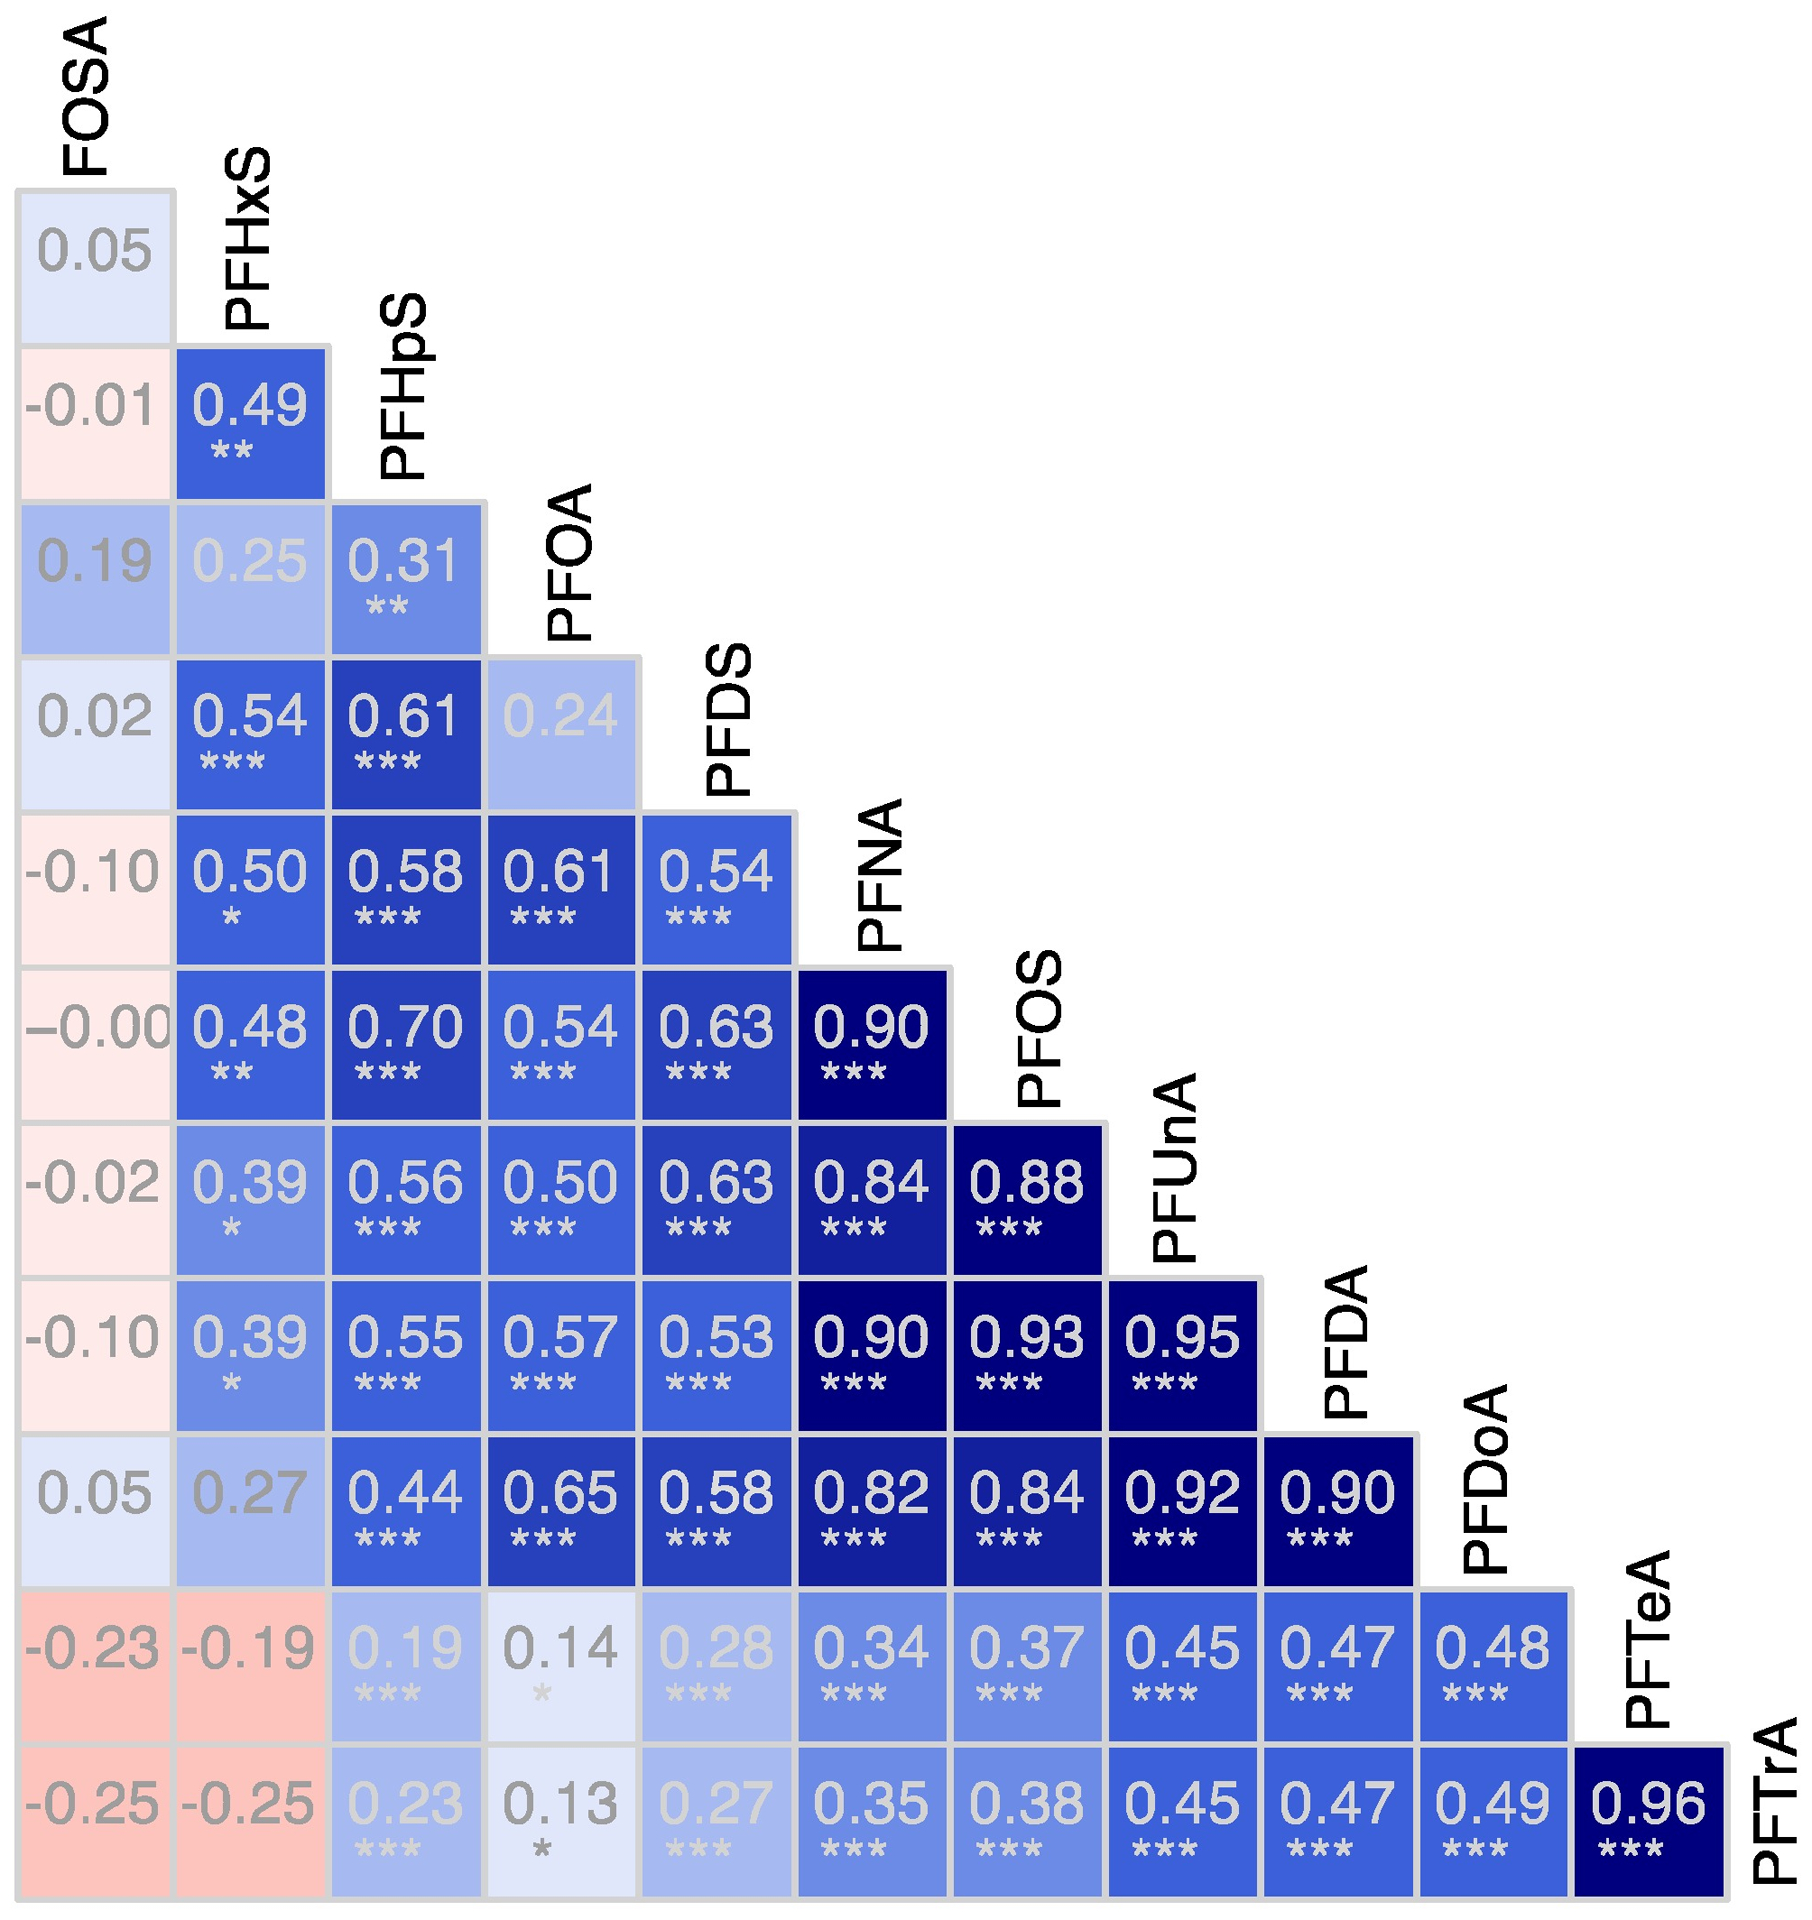
Figure 2.

Correlation matrix for PFASs measured in pilot whale muscle tissue (Globicephala melas) in 2013. Numbers indicate Spearman correlation coefficients for a two-sided statistical test. The intensities of blue and red show the strength of positive and negative correlations, respectively. Significant correlations are denoted by asterisks (* = p<0.05; **=p<0.005, ***=p<0.0005).
