
Figure 4.
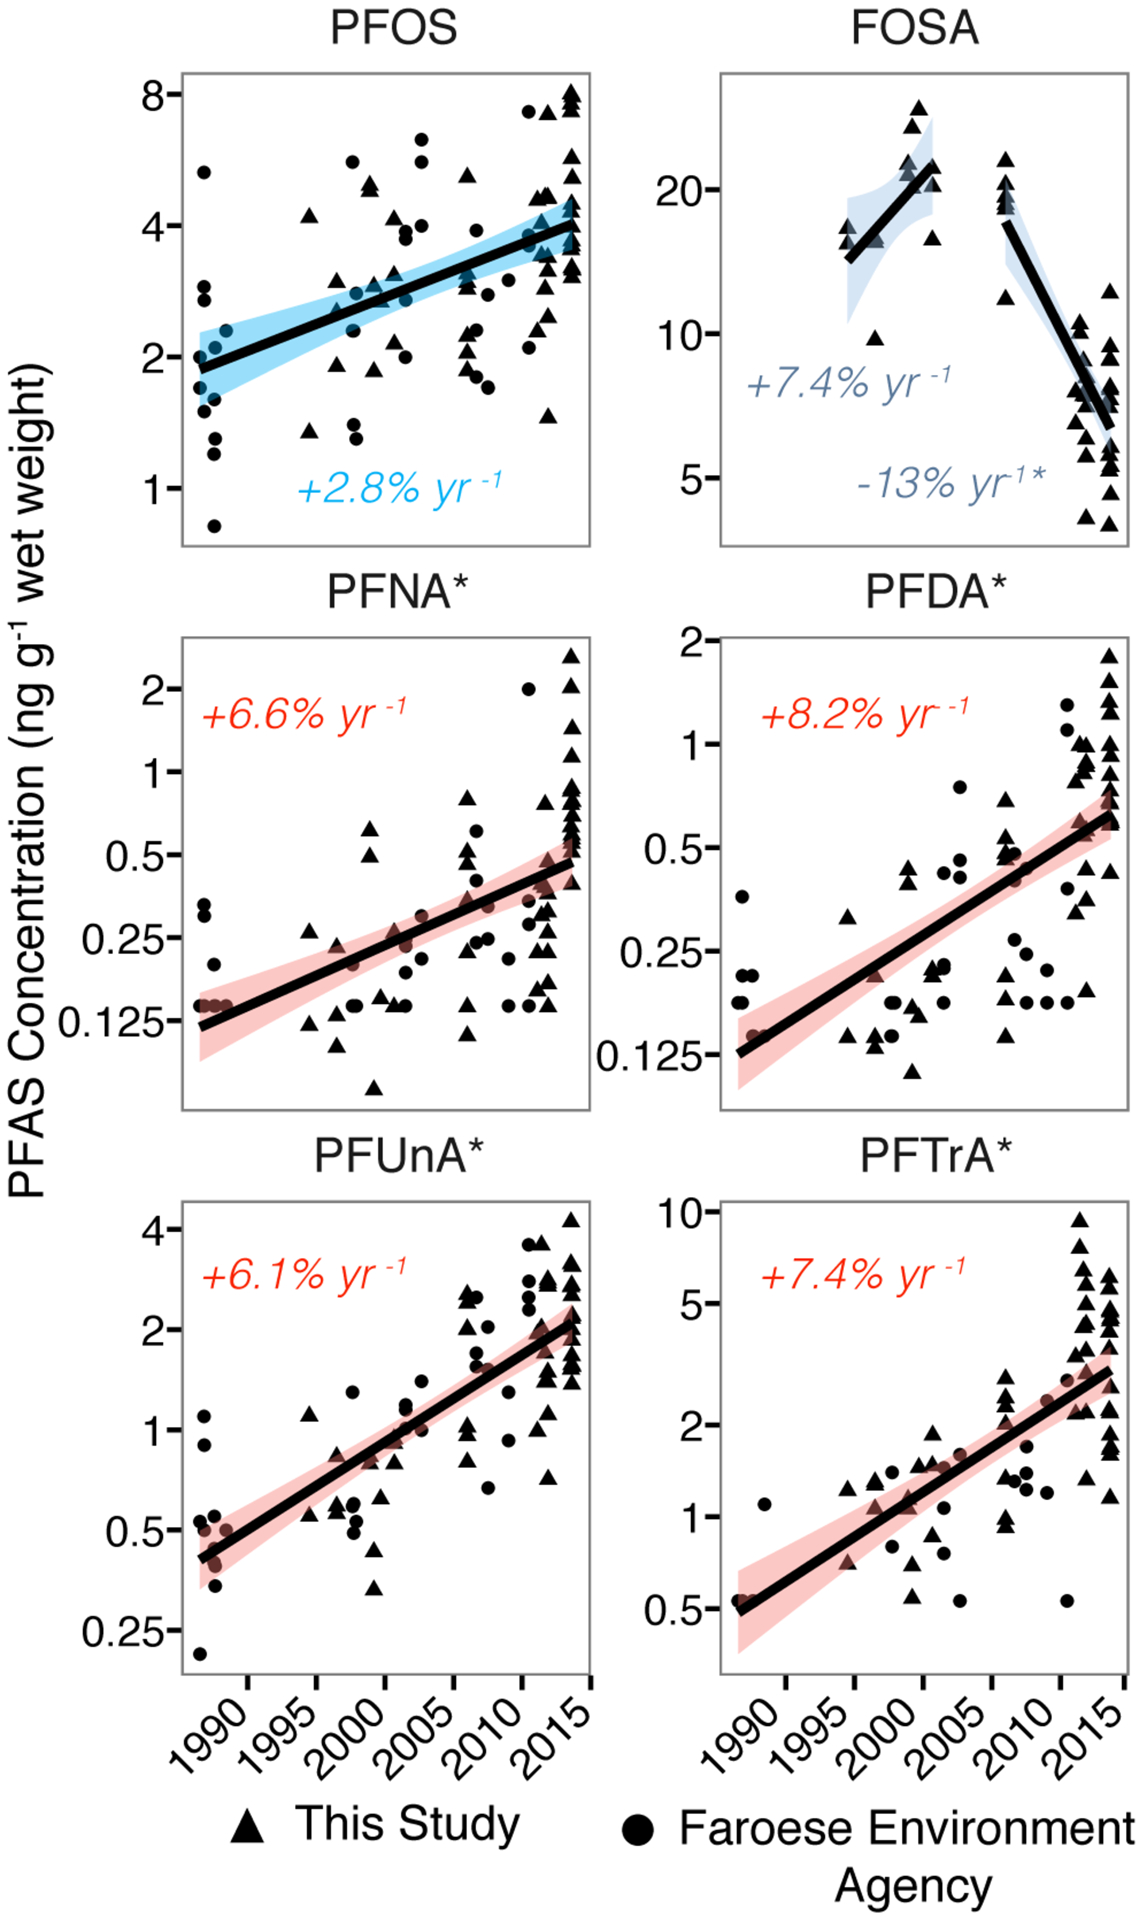
Temporal trends in concentrations of selected PFASs in juvenile male North Atlantic pilot whale muscle tissue (Globicephala melas) between 1986 and 2013. All trends (shown as percent annual changes) are significant at the p<0.05 level based on linear regression of log-transformed concentrations. Shaded areas represent 95% confidence intervals of the mean. Triangles are pilot whale analyzed for this study and circles are analyzed by the Faroese Environment Agency.41 For compounds denoted by ‘*’ non-detects are represented in plots as the detection limit multiplied by 1/√2.46, but slopes are based on maximum likelihood estimates for non-detect values.45