Figure 1.

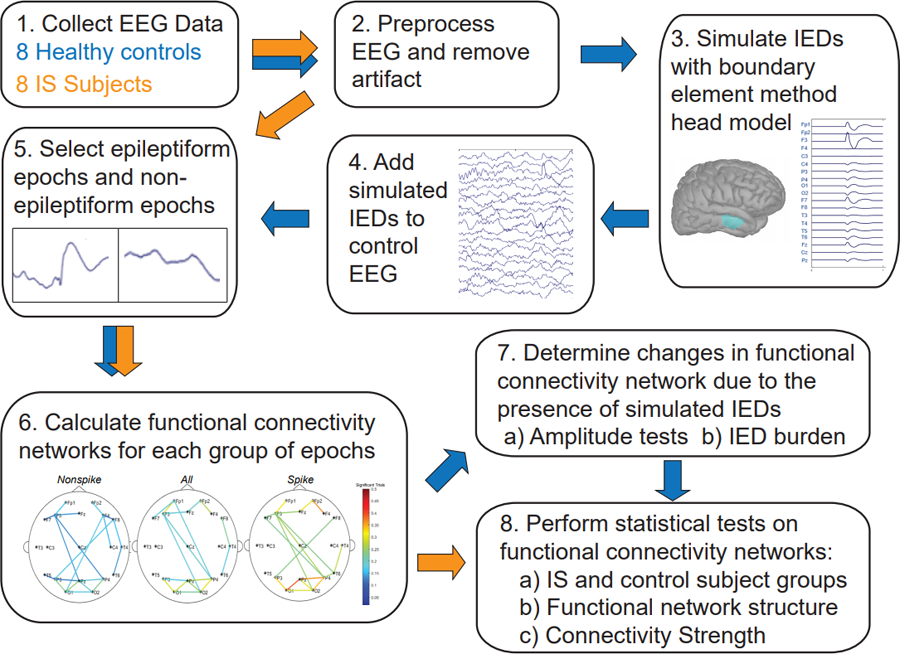
Summary of the functional connectivity analysis. Blue arrows indicate the data analysis procedure for the control subject EEG, while orange arrows indicate the procedure for analysis of EEG data from subjects with epilepsy.

Summary of the functional connectivity analysis. Blue arrows indicate the data analysis procedure for the control subject EEG, while orange arrows indicate the procedure for analysis of EEG data from subjects with epilepsy.