
Figure 10.
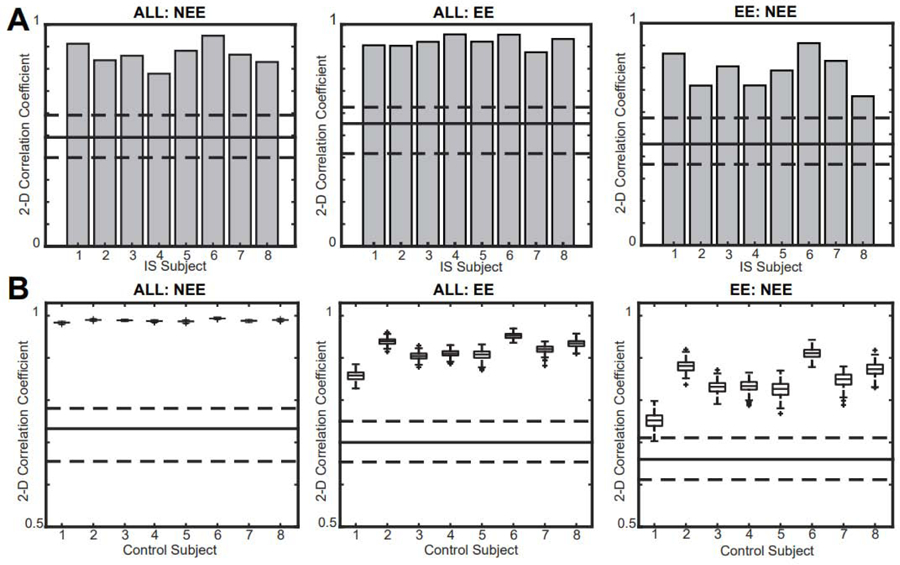
2D correlation coefficients for all intra-subject network comparisons are significantly higher than inter-subject comparisons in (A) IS subjects and (B) controls. Gray bars represent intra-subject comparisons for IS subjects, and box plots represent intra-subject values from 200 simulations in controls. The solid line represents the median of the inter-subject correlation values and the dashed lines represent the 25th and 75th percentiles.
IS: infantile spasms.