
Figure 9.
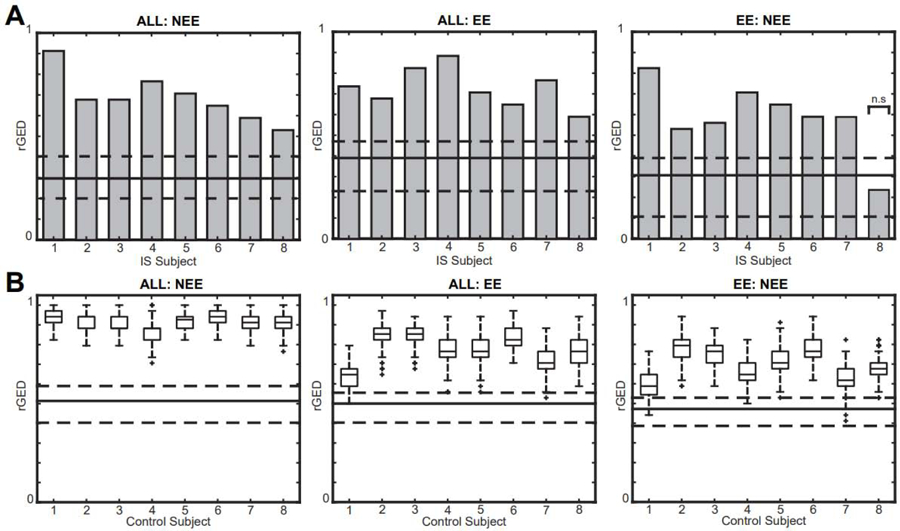
Relative graph edit distance (rGED) values for intra-subject network comparisons are significantly higher than inter-subject comparisons in (A) IS subjects and (B) control subjects with simulated IEDs. Gray bars represent intra-subject comparisons for IS subjects, and box plots represent intra-subject values from 200 simulations in controls. The solid lines represent the median of the inter-subject rGED values and the dashed lines represent the 25th and 75th percentiles. All tests are significant except EE:NEE in IS subject 8.
IED: interictal epileptiform discharge; EE: epileptiform epochs; NEE: non-epileptiform epochs; IS: infantile spasms.