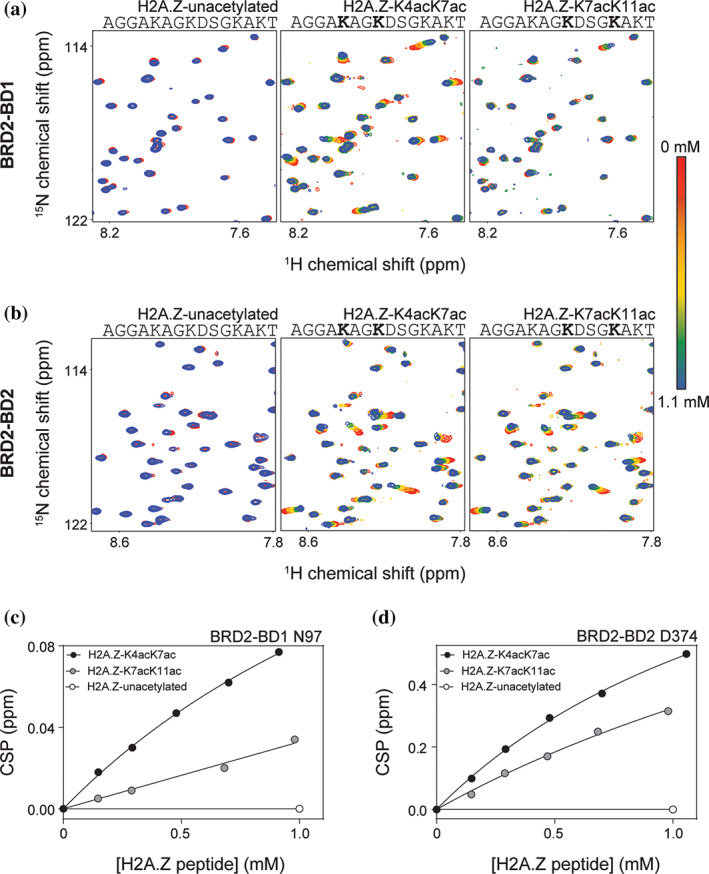
FIGURE 2.

15N‐HSQC titration data for BRD2 BD‐H2A.Z peptide interactions. (a) 15N‐HSQC titrations monitoring the addition of the indicated H2A.Z peptides (up to 1.1 mM peptide—~10 molar equivalents) to BRD2‐BD1 (~100 μM). (b) 15N‐HSQC titrations monitoring the addition of the indicated H2A.Z peptides (up to 1.1 mM peptide—~10 molar equivalents) to BRD2‐BD2 (~100 μM). (c) Binding curves derived by tracking the 15N CSP in BRD2‐BD1 N97 in response to titration with the indicated H2A.Z peptide variants. The data were fitted to a simple 1:1 binding isotherm using GraphPad. (d). Binding curves derived by tracking the 15NCSP induced in BRD2‐BD2 D374 in response to titration with the indicated H2A.Z peptide variants. The data were fitted to a simple 1:1 binding isotherm using GraphPad
