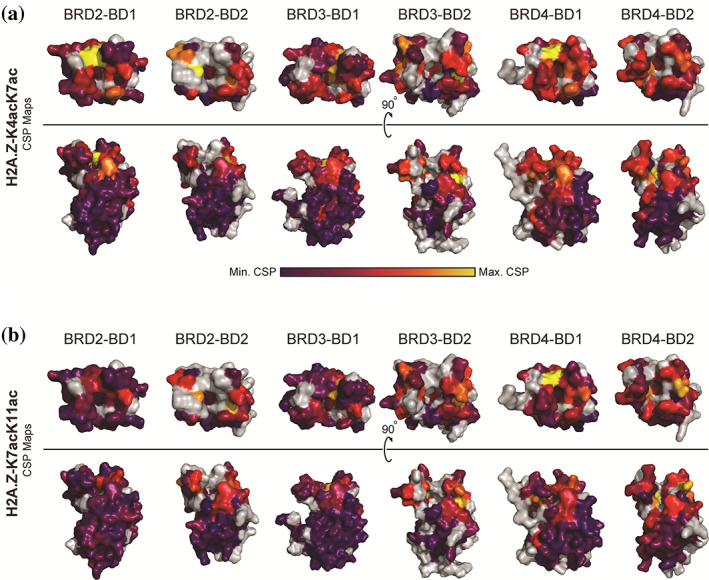
FIGURE 4.

Structural mapping of the 1H and 15N CSP data for the interactions of BET BDs with H2A.Z‐K4acK7ac and H2A.Z‐K7acK11ac. (a) CSPs observed upon the formation of a complex with H2A.Z‐K4acK7ac are mapped onto the structures of the BET BDs (PDB IDs: 4UYF for BRD2‐BD1, 3ONI for BRD2‐BD2, 3S91 for BRD3BD1, 3S92 for BRD3‐BD2, 4LYI for BRD4‐BD1, and 5UVV for BRD4‐BD2). 29 , 30 , 31 CSP magnitude is displayed through a purple–red–yellow gradient in which purple indicates no CSP and yellow indicates the maximum CSPs. Unassigned residues are gray. (b) CSPs observed upon the formation of a complex with H2A.Z‐K7acK11ac are mapped onto the structures of the BET BDs (PDB IDs: 4UYF for BRD2‐BD1, 3ONI for BRD2‐BD2, 3S91 for BRD3BD1, 3S92 for BRD3‐BD2, 4LYI for BRD4‐BD1, and 5UVV for BRD4‐BD2). 29 , 30 , 31 CSP magnitude is displayed through a purple–red–yellow gradient in which purple indicates no CSP and yellow indicates the maximum CSPs. Unassigned residues are gray
