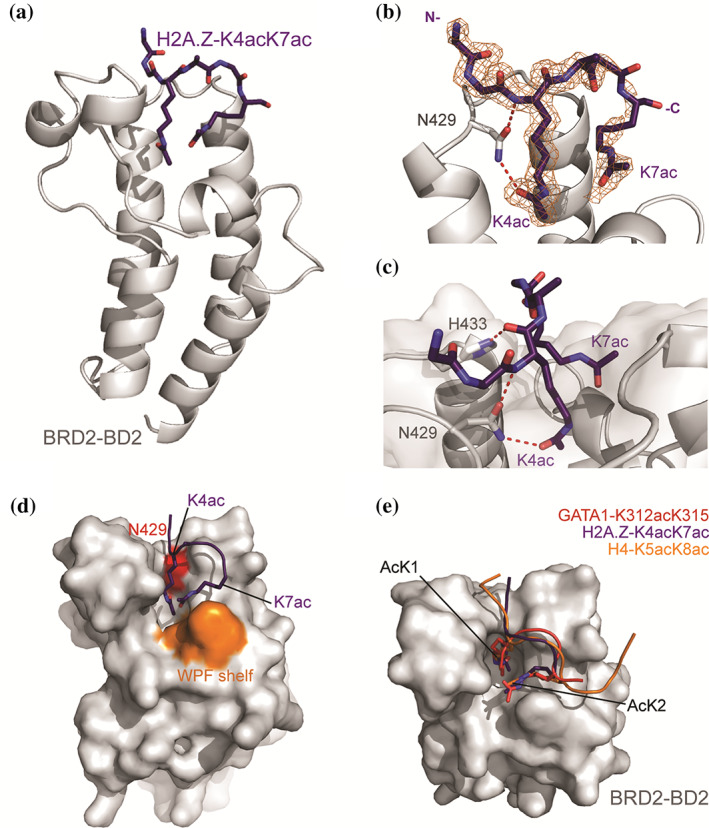
FIGURE 5.

Crystal structure of BRD2‐BD2 in complex with H2A.Z.1‐K4acK7ac (1.75 Å resolution, PDB ID: 7JX7). (a) Ribbon diagram representation of BRD2‐BD2 (gray) in complex with H2A.Z.1‐K4acK7ac (purple, shown as sticks). (b) Close up of the interaction between H2A.Z.1‐K4acK7ac and BRD2‐BD2. The 2Fo‐Fc map for the H2A.Z.1‐K4acK7ac density is shown as an orange mesh. The conserved asparagine (N429) that forms a hydrogen bond with the AcK is shown as sticks, with the hydrogen bonds as red dashed lines. (c) Depiction of all hydrogen bonds formed between BRD2‐BD2 and the H2A.Z.1‐K4acK7ac. Hydrogen bonds are shown as red dashed lines. (d) Surface representation of BRD2‐BD2 highlighting the WPF shelf and conserved N429 residue in orange and red, respectively. The H2A.Z.1‐K4acK7ac peptide is shown as a cartoon with the two AcK residues shown as sticks. The C‐terminal AcK (K7ac) contacts the WPF shelf. (e) Overlay of H2A.Z.1‐K4acK7ac with the BD‐bound conformations of diacetylated GATA1 (K312acK315ac, PDB ID: 2L5E, red) and diacetylated H4 (K5acK8ac, PDB ID: 3UVW, orange)
