
TABLE 3.
Analysis of sterically acceptable organic anions docked at the iron binding site of MsTsf1
| Anion | Structure | Average RMSD deviation from carbonate (Å) | Average energy (kcal/mol) |
|---|---|---|---|
| Acetoacetate |

|
1.52 | −4.0 |
| α‐Ketoglutarate |
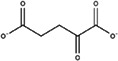
|
1.40 | −4.8 |
| Ascorbate |

|
2.86 | −5.3 |
| Carbonate a |

|
1.16/0.27 | −3.2/−3.5 |
| Fumarate |

|
2.21 | −4.0 |
| Glycine |

|
0.84 | −3.1 |
| Glyoxylate |

|
1.68 | −3.6 |
| Lactate |

|
1.24 | −3.6 |
| Malate |
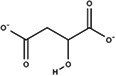
|
3.42 | −4.4 |
| Oxaloacetate |
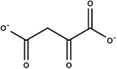
|
1.21 | −4.6 |
| Pyruvate |

|
1.74 | −3.8 |
| Succinate |
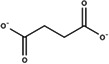
|
2.30 | −4.3 |
a
The docked carbonate results have two values, the first being the measurements of the docking result at the CO3 2−‐1 position (solvent exposed carbonate) and the second being the CO3 2−‐2 position (buried carbonate).