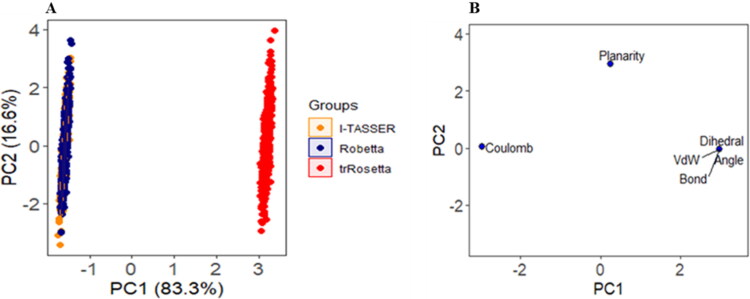
Figure 6.
PCA analysis on MD simulation. (a) The score plot represents three clusters for model M protein structures, where each dot indicates one time point. The clustering is attributable as: I-TASSER (orange), Robetta (blue), trRosetta (red). (b) Loading plot exhibits the energy and structural data from principal components analysis.

