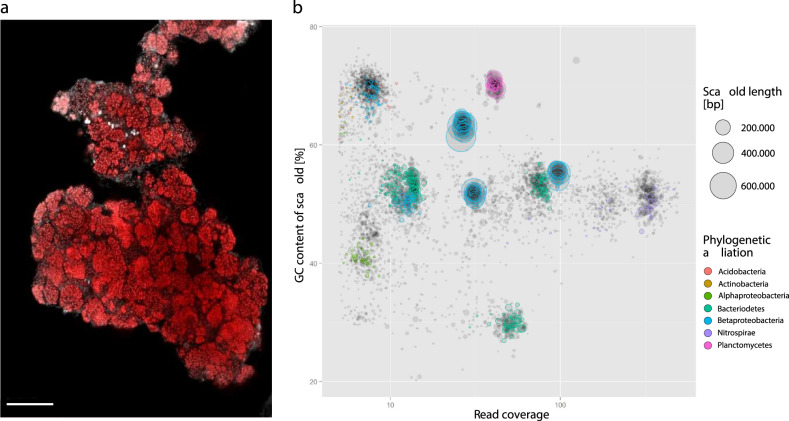
Fig. 4. Visualization and metagenomic analysis of the “Ca. N. alkalitolerans” enrichment.
a FISH image showing dense cell clusters of “Ca. N. alkalitolerans” in the enrichment culture. The “Ca. N. alkalitolerans” cells appear in red (labeled by probe Ntspa1151 which has 1 mismatch at the 3’ end to the 16S rRNA gene sequence of “Ca. N. alkalitolerans”; the absence of lineage II Nitrospira in the enrichment culture was confirmed by the application of the competitor oligonucleotides c1Ntspa1151 and c2Ntspa1151 as indicated in the Supplementary text). Other organisms were stained by DAPI and are shown in light gray. Scale bar, 25 µm. b Phylogenetic affiliation of the metagenome scaffolds from the “Ca. N. alkalitolerans” enrichment, clustered based on sequence coverage and the GC content of DNA. Closed circles represent scaffolds, scaled by the square root of their length. Clusters of similarly colored circles represent potential genome bins.

