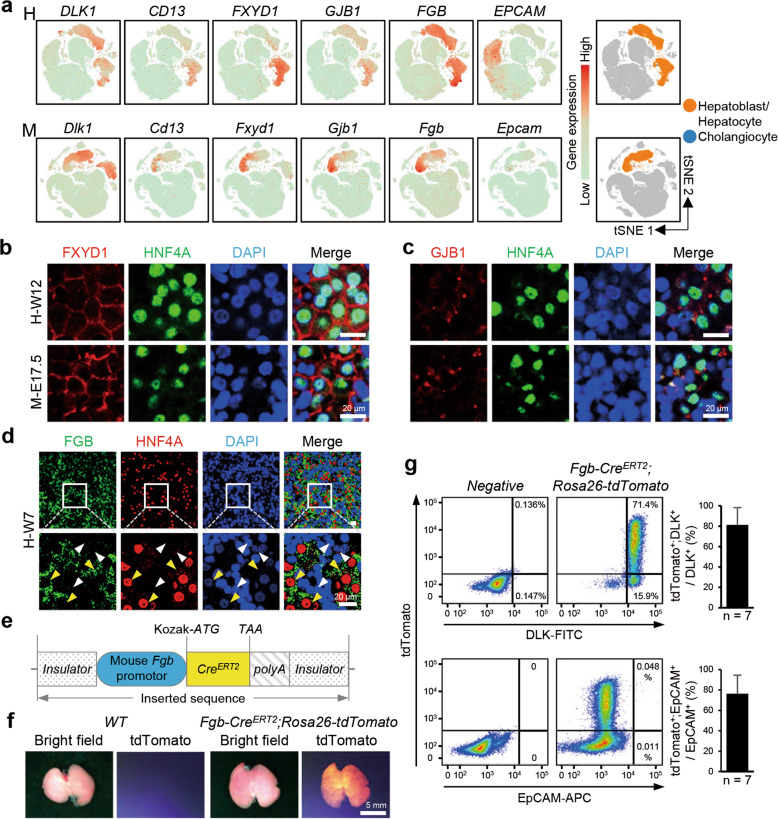
Fig. 2. Identification of novel markers of hepatic cells.
a t-SNE plots showing the expression levels of hepatobiliary marker genes. b Immunofluorescence showing the expression and distribution of FXYD1 and HNF4A in the W12 human (H-W12) and E17.5 mouse (M-E17.5) fetal livers. Scale bars, 20 μm. c Immunofluorescence showing the expression and distribution of GJB1 and HNF4A in the W12 human (H-W12) and E17.5 mouse (M-E17.5) fetal livers. Scale bars, 20 μm. d Immunofluorescence showing the expression and distribution of FGB and HNF4A in the W7 human (H-W7) fetal liver. The yellow arrowhead indicates the FGB+HNF4A+ hepatoblasts. The white arrowhead indicates the FGB–HNF4A– cells. Scale bars, 20 μm. e Schematics of strategies for the generation of Fgb-CreERT2 transgenic mice. f Morphologies and tdTomato signals in the livers of E17.5 WT and Fgb-CreERT2;Rosa26-tdTomato mice. Scale bars, 5 mm. g FACS gating and statistical analysis showing the percentage of tdTomato+DLK+/DLK+ (upper) and tdTomato+EpCAM+/EpCAM+ (lower) cells in E17.5 WT and Fgb-CreERT2;Rosa26-tdTomato mice. n, number of embryos.

