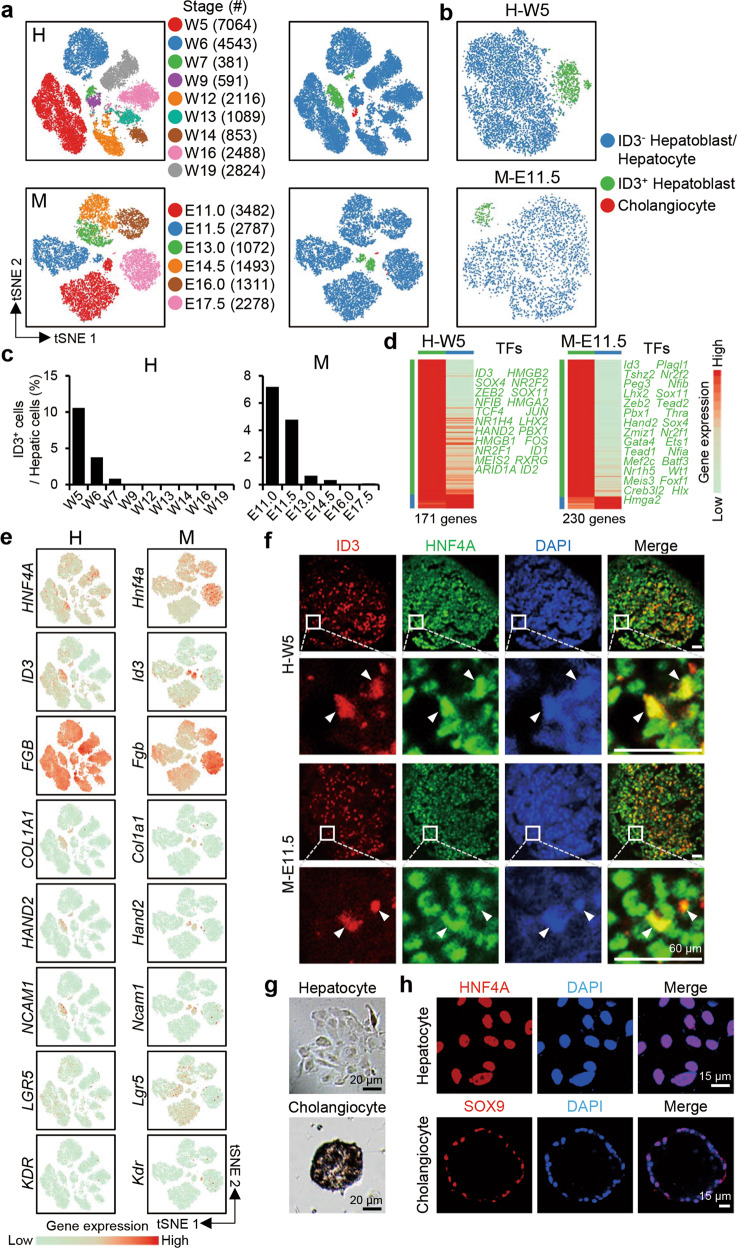
Fig. 3. Identification of two hepatoblast subpopulations.
a t-SNE plots showing the developmental stages (left) and clusters (right) of human (H) and mouse (M) endoderm-derived cells. b t-SNE plots showing the distinct clusters of ID3+ and ID3– hepatoblasts in the W5 human (H-W5) and E11.5 mouse (M-E11.5) fetal livers. c The proportion of ID3+ cells in human (H) and mouse (M) hepatoblasts/hepatocytes at different developmental time points. d Differentially expressed genes in W5 human (H-W5) and E11.5 mouse (M-E11.5) ID3+ and ID3– hepatoblasts. Each column represents a cell type and each row represents a gene. The TFs associated with each cell type are listed on the right. The color scheme is the same as b. e t-SNE plots showing the expression levels of marker genes. f Immunofluorescence showing the expression and distribution of ID3 and HNF4A in the W5 human (H-W5) and E11.5 mouse (M-E11.5) fetal livers. The arrowheads indicate ID3+ hepatoblasts. Scale bars, 60 μm. g The morphology of cultured hepatocytes (after 6-day culture from NCAM1+DLK+ hepatoblasts) and cholangiocyte tissue (after 10-day culture from NCAM1+DLK+ hepatoblasts). Scale bars, 20 μm. h Immunofluorescence showing the expression and distribution of HNF4A and SOX9 in cultured hepatocytes (upper) and cholangiocytes (lower), respectively. Scale bars, 15 μm.

