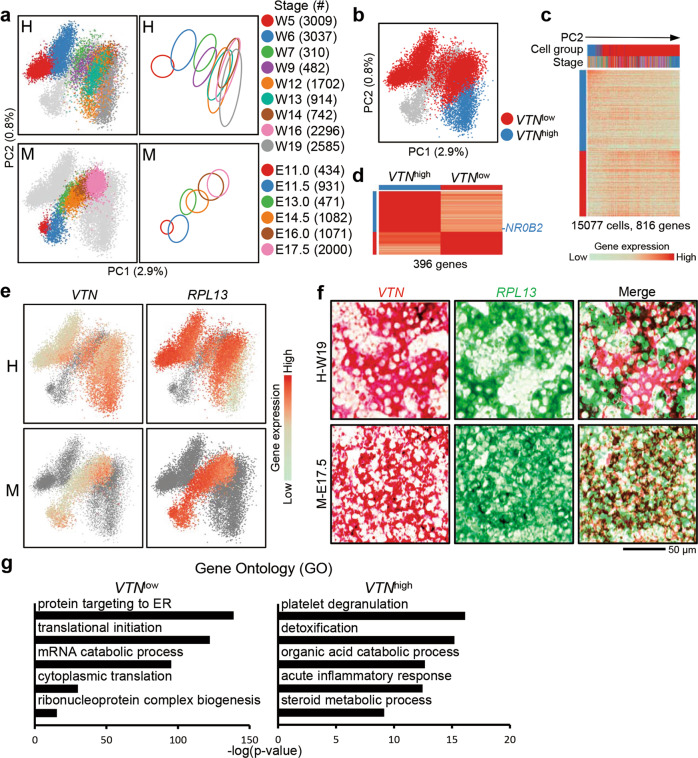
Fig. 5. Heterogeneity of quiescent human hepatocytes.
a Left: PCA plots of human (H) and mouse (M) quiescent hepatoblasts/hepatocytes. Right: Schematic summary of quiescent hepatoblast/hepatocyte development based on the PCA plots. b PCA plots showing the clustering of human VTNlow and VTNhigh hepatocytes based on PC2-related genes. c Heatmap showing the expression of PC2-related genes in human hepatoblasts/hepatocytes ordered by PC2 values. Each column represents a cell and each row represents a gene. The color scheme of cell stages is the same as a. d Differentially expressed genes in VTNlow and VTNhigh hepatocytes. The TFs of each gene group are listed on the right. e Expression levels of the marker genes VTN and RPL13 in human (H) and mouse (M) hepatoblasts/hepatocytes. f In situ hybridization of sequential sections showing the distribution of VTN and RPL13 in the W19 human (H-W19) and E17.5 mouse (M-E17.5) fetal livers. Scale bars, 50 μm. g GO analysis of genes differentially expressed in W19 human VTNlow and VTNhigh hepatocytes.

