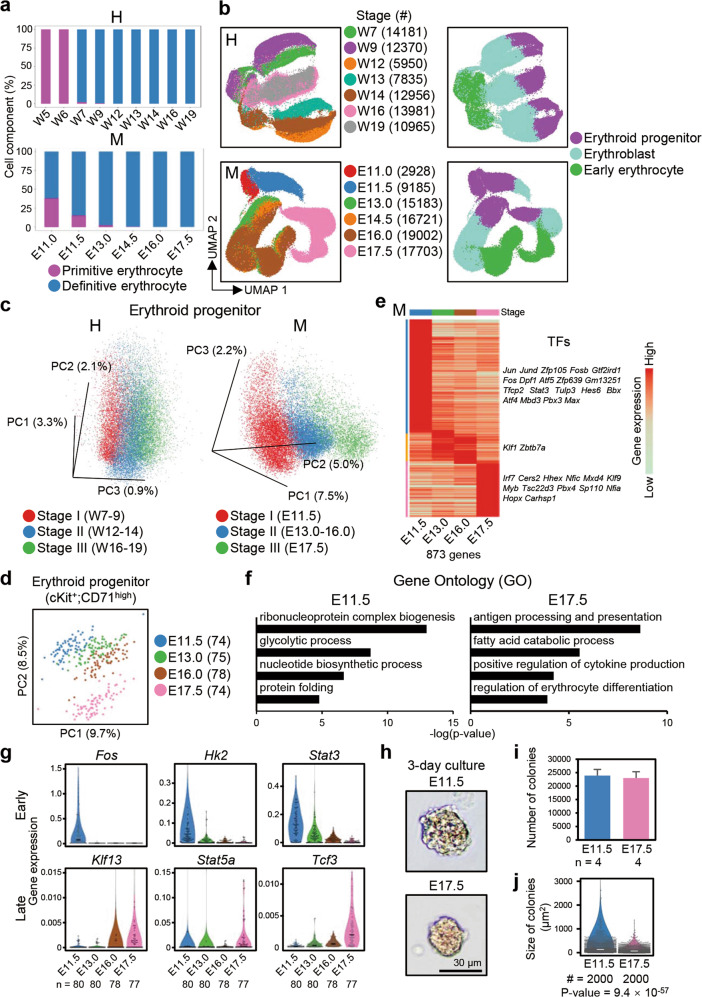
Fig. 6. Erythropoiesis in the fetal liver.
a The proportion of primitive erythrocytes in human (H) and mouse (M) whole erythrocytes at different developmental time points. b UMAP plots showing developmental stages and cell types during erythropoiesis in the human (H) and mouse (M) fetal livers. c 3D-PCA plots showing the maturation of human (H) and mouse (M) erythroid progenitors. d PCA plots of mSTRT-seq data showing the maturation of E11.5–E17.5 mouse cKit+CD71high cells. e Heatmap of mSTRT-seq data showing differentially expressed genes in E11.5–E17.5 mouse erythroid progenitors. Each column represents a stage and each row represents a gene. The TFs of each stage are listed on the right. f GO analysis of genes differentially expressed in cKit+CD71high E11.5 and E17.5 cells. g Violin plots showing the expression levels of marker genes of E11.5–E17.5 mouse cKit+CD71high cells validated by single-cell RT-qPCR. The y-axis represents the relative expression values normalized to Gapdh expression. Each dot represents a single cell. The black line within each violin plot indicates the median of the expression levels. n, number of single cells. h The morphology of E11.5 and E17.5 mouse cKit+CD71high cells cultured for 3 days. Scale bars, 30 μm. i Statistical analysis showing the number of colonies for cultured E11.5 and E17.5 mouse cKit+CD71high cells. n, number of biological replicates. j Statistical analysis showing the size of the colonies for cultured E11.5 and E17.5 mouse cKit+CD71high cells. The white line indicates the median size of colonies. #, number of randomly selected colonies used to determine the size statistics.

