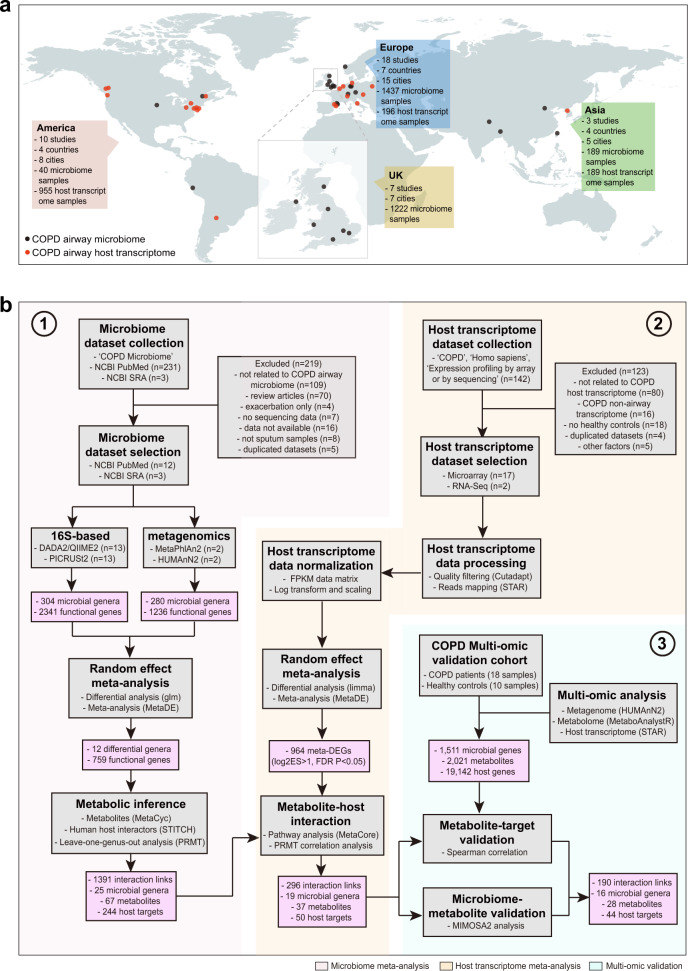
Fig. 1. The multi-omic meta-analysis pipeline for the COPD airway microbiome.
a Geographical distribution of collection sites for 1666 airway microbiome samples (1640 samples from 16S rRNA gene datasets and 26 samples from metagenomic datasets) and 1340 host transcriptome samples included in the meta-analysis. b Flowchart of the integrative meta-analysis for microbiome and host transcriptome datasets, as well as the independent multi-omic cohort validation. Each data analysis step is shown in the gray box, with the analysis method and software described within. In the steps of dataset collection and processing, n represents the number of studies/datasets involved in each step. The output of key steps is shown in the pink box.

