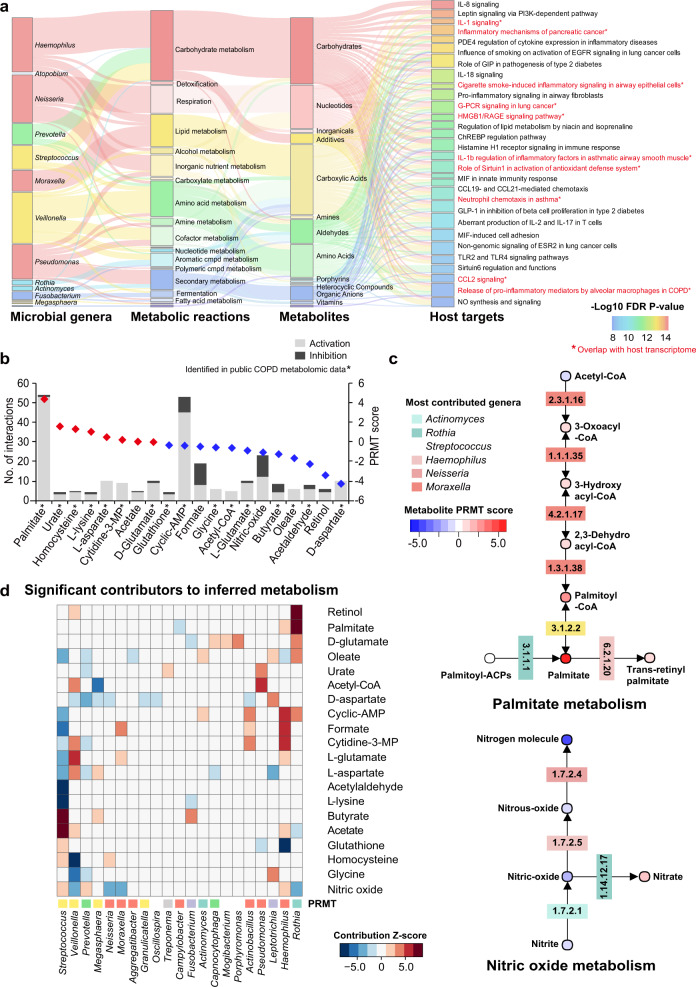
Fig. 3. Metabolic inference of the COPD airway microbiome.
a Sankey diagram delineating all interaction links between microbial genera, metabolic reactions, inferred metabolites, and host targets. Metabolic reactions were grouped by the MetaCyc pathway categories. Metabolites were grouped by their classes in PubChem. Host genes were grouped by the enriched pathways and only genes in the top pathways (FDR P < 1e−8) are shown. Pathways were highlighted in red and in asterisks if they overlapped with the 54 pathways significantly enriched for differentially expressed genes in the host transcriptome meta-analysis. b The inferred metabolites ranked by their PRMT scores. The 20 metabolites with at least 5 interactions with host targets were shown for display purpose. The metabolite was highlighted in asterisks if it was present in the public COPD airway metabolomic data. c The biosynthesis pathways for palmitate and nitric oxide. Each metabolite was colored by its PRMT score and each corresponding gene was colored by its most predominant microbial contributor. d Heatmap showing significant microbial contributors to the 20 metabolites in (b) in the leave-one-genus-out (LOGO) analysis (absolute z-score > 2.0, P < 0.05). The z-score of each species to each metabolite was indicated in the heatmap. A positive z-score means that the biosynthesis or degradation of the metabolite by the taxa contributes to its relative enrichment in COPD, whereas a negative z-score means the biosynthesis or degradation of the metabolite by the taxa contributes to its depletion in COPD. The microbial genera were colored by their corresponding phyla. The PRMT score was shown for each metabolite beside the heatmap.

