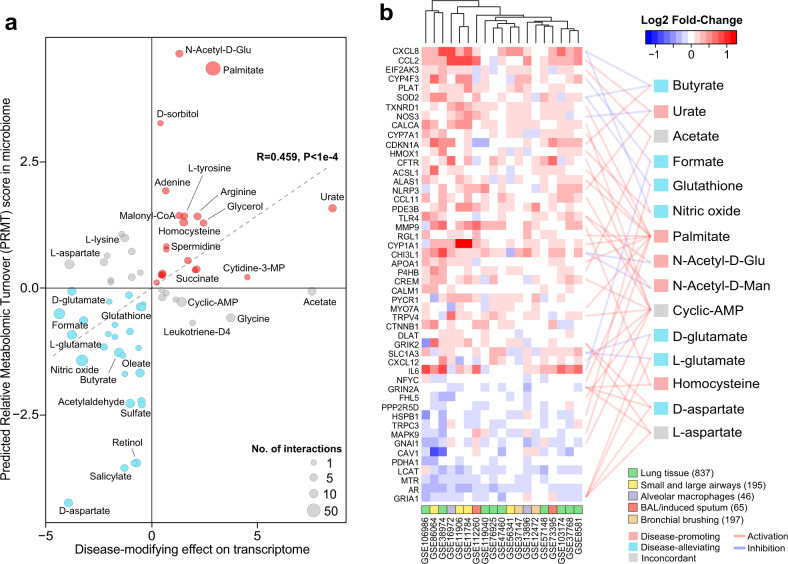
Fig. 4. Microbiome metabolites target genes in COPD host transcriptome signature.
a Scatterplot showing the predicted disease-modifying effects of metabolites on host transcriptome (x-axis) and their PRMT scores in COPD airway microbiome (y-axis). The direction of disease-modifying effects were concordant with that of the PRMT scores for 44 out of 58 metabolites (Spearman’s R = 0.507, P < 1e−4). Metabolites were colored in red if they had concordant disease-promoting effects, in blue if they had concordant disease-ameliorating effects, and in gray if they had discordant effects. The size of the circles in the plot are proportional to the number of predicted host interactors for the metabolites. b Heatmap for the 41 meta-DEGs that were linked to at least one microbial metabolites. Only metabolites linked to at least two host genes were shown for display purpose. Each link between a metabolite and a gene indicate their interactions colored by activation or inhibition as obtained from the STITCH database. Metabolites were colored similarly as in (a). The number of samples were indicated in the parenthesis besides each sample type.

