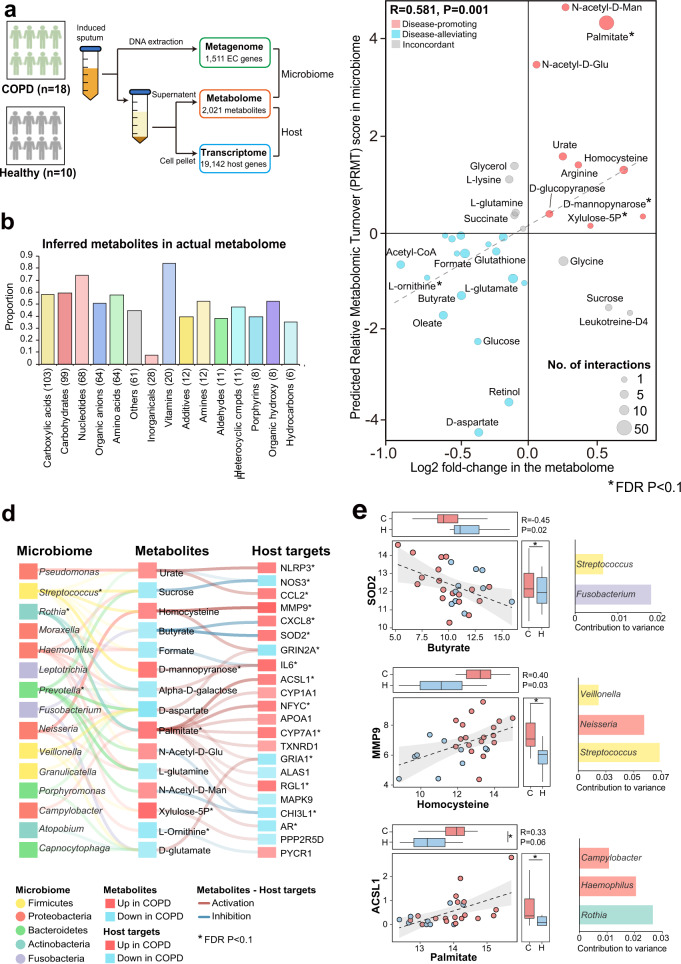
Fig. 5. Validation of “microbiome-metabolite–host” interaction links in the independent COPD multi-omic cohort.
a A schematic illustration for the sample processing steps to simultaneously obtain metagenome, metabolome and host transcriptome from sputum samples. b The proportion of the 575 inferred metabolites detected in the actual metabolome in each category. The number of inferred metabolites in each category were indicated in the parenthesis. c Scatterplot showing the overall concordance between the PRMT scores of the 31 metabolites and their log2 fold-changes in COPD versus controls in the metabolome. The sizes of the circles in the plot are proportional to the number of predicted host interactors for the metabolites. Metabolites were colored similarly in Fig. 4. Significant metabolites in COPD versus controls (FDR P < 0.1) were highlighted in asterisks. d The 91 “microbiome-metabolite–host” interaction links that were validated in the COPD multi-omic cohort and involved at least one metabolite or host targets significant in COPD versus controls (FDR P < 0.1). The microbial genera were colored by their corresponding phyla. The metabolites and host targets were colored by their direction of changes in COPD versus controls with the strength of the color representing their absolute fold-change. The links between metabolites to host targets were colored by the activation or inhibition effects and the strength of the links are proportional to the absolute Spearman correlation coefficient between the paired metabolome and host transcriptome. The strength of the links between microbial taxa and metabolites are proportional to the contribution scores of the genus to the metabolite between the paired metagenome and metabolome in MIMOSA2 analysis. The significant metabolites and host targets were highlighted in asterisks (FDR P < 0.1). e The scatterplot for the top three metabolite–host target correlations in (d). Samples were colored by COPD or controls. The distribution of metabolites and host targets in COPD and controls were shown in the boxplots. The significant genera, metabolites and host targets were highlighted in asterisks (FDR P < 0.1). For significant genus-level contributors to the metabolites, their contributions to variance in MIMOSA2 analysis were shown on the right side.

