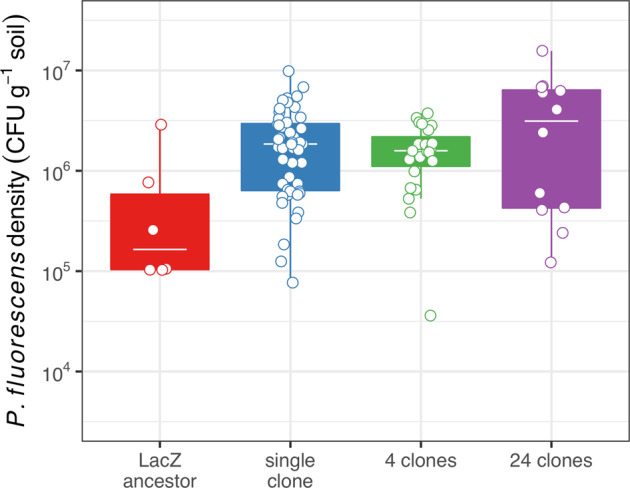
Fig. 7. Density of the focal species at the end of the experiment.

Tops and bottoms of the bars represent the 75th and 25th percentiles of the data, the white lines are the medians, and the whiskers extend from their respective hinge to the smallest or largest value no further than 1.5*interquartile range. Points represent the log10-transformed density of an individual replicate population.
