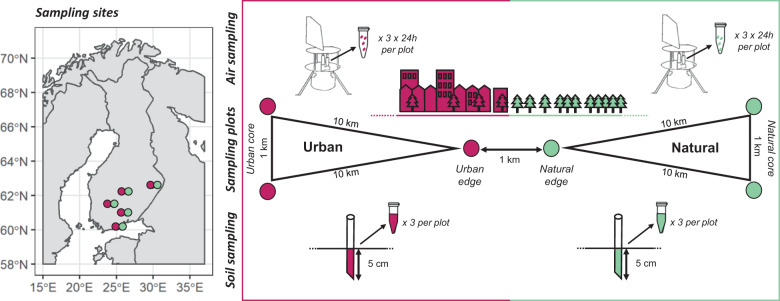
Fig. 1. Study design.
The location of the five Finnish cities are shown in the left-hand panel and the sampling sceme within each of the cities is shown in the right-hand panel, fuksia (respectively green) color illustrating the sampling carried out in urban areas (respectively natural areas). Within each site, three plots were located in natural and other three plots in urban areas, representing the core and edges of both area types. Fungal communities were sampled from the air (24 h sample taken by the cyclone sampler) and from the soil (a mixture of three soil samples). From each plot, three replicate air and three replicate soil samples were taken.

