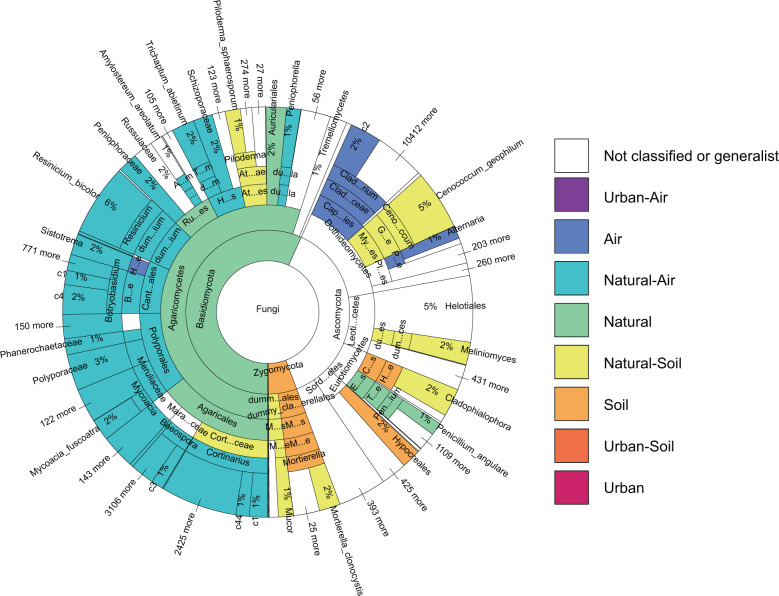
Fig. 3. Fungal taxonomic composition in air and soil of urban and natural sites.
The Krona wheel showing the taxonomic levels to which each of the 79,155 identified fungal species (OTUs) belongs. The coloring shows the taxa that are predominantly (with >10 times higher DNA abundance) found from air or from soil, from natural or from urban habitats, and the combination of these two classifications (see “Methods” for criteria used when performing the classifications). Sector areas are proportional to DNA abundance, the percentage numbers showing the percentage of total DNA abundance belonging to the taxa contained in the sector. This figure shows pooled data from all sample types, whereas sample-type specific versions are shown in Figure. For an interactive version of the Krona wheel that allows detailed examination of each taxonomic level, as well as for the same information as numerical table format, see Supplementary Information.

