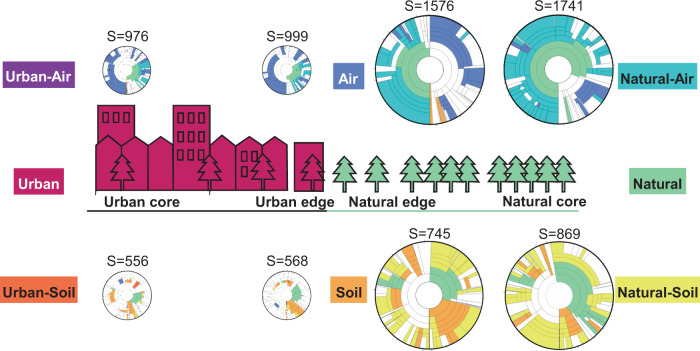
Fig. 4. Taxonomic composition and DNA abundance of fungi in air and soil along the gradient from urban core areas to natural core areas.
The Krona wheels show the taxonomic composition of the OTUs found from each sample type. The predicted species richness per sample is shown by S, and the predicted amount of DNA per sample is represented by the relative sizes of the Krona wheels. The coloring follows the classification in Fig. 3. As DNA abundance was measured in different units for the soil and the air, the sizes for the Krona wheels are not comparable between these two sample types. For interactive versions of the eight Krona wheels shown in this figure that allow detailed examination of each taxonomic level, see Supplementary Information.

