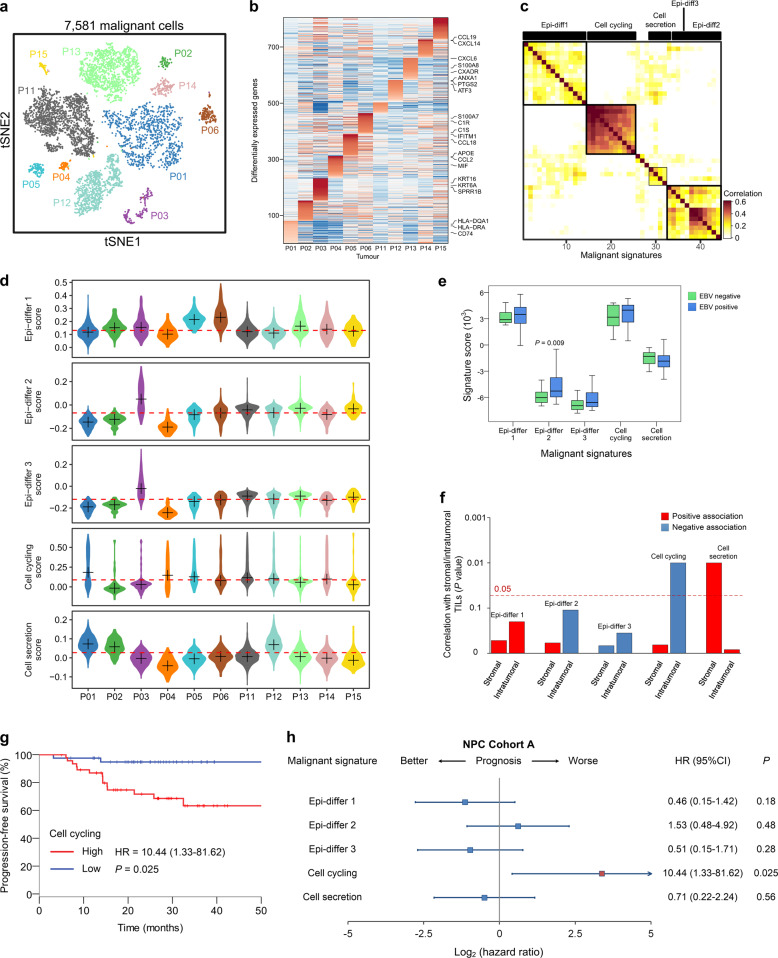
Fig. 2. Malignant cell clusters and common malignant signatures revealed in NPC.
a t-SNE plot of 7581 malignant cells from 11 patients (indicated by colors) reveals tumor-specific clusters. b A heatmap shows genes (rows) that are differentially expressed across 11 individual primary tumors (columns). Red: high expression; blue: low expression. Selected genes are highlighted. c A heatmap depicts the pairwise correlations of 44 metagenes derived from 11 tumors. Clustering identified five coherent malignant gene expression signatures across the tumors. d Each panel (from top to bottom) shows violin plots that depict the scores for one of the five malignant signatures for malignant cells from the 11 tumors. e Changes in gene expression for the five malignant signatures in response to different EBV infection statuses (95 positive vs 14 negative, detected by in situ hydridization with the EBV-encoded small RNAs) in NPC Cohort A are shown (P values were based on the Wilcoxon rank-sum test). The box plot center corresponds to the median, with the box and whiskers corresponding to the interquartile range and 1.5× interquartile range, respectively. f A bar plot shows the direction and statistical significance (P values were based on the Spearman correlation test) of the associations between each of the malignant signatures and stromal/intratumoral TILs in NPC Cohort A. g Kaplan–Meier curves for progression-free survival in the 88 patients in NPC Cohort A stratified according to high vs low expression of the cell cycling signature. Cox regression HR and 95% CI obtained after correcting for age, sex, smoking history and disease stage are shown; the corresponding Cox regression P value is also shown. h Prognostic values of the malignant signatures in the 88 patients in NPC Cohort A. Forest plots show HRs (blue/red squares) and CIs (horizontal ranges) derived from Cox regression survival analyses for progression-free survival in multivariable analyses adjusted for age, sex, smoking history and disease stage; the corresponding Cox regression P values are also shown. Significant results are indicated with red squares.

