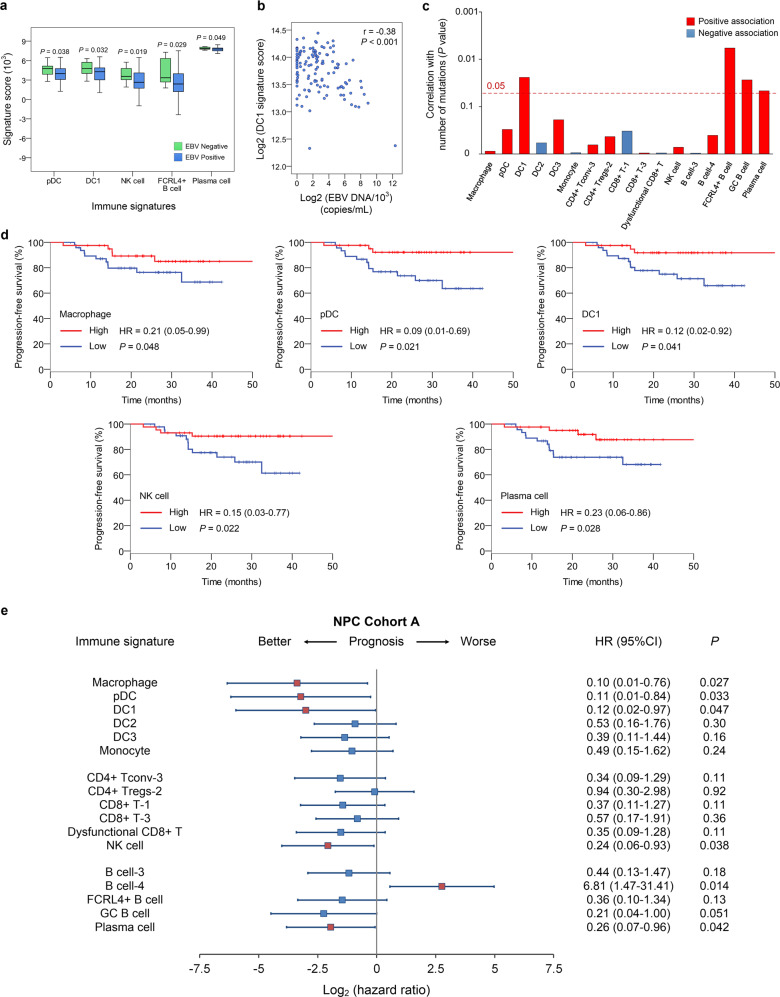
Fig. 7. Correlations of immune subtype-specific signatures with clinicopathological features and survival in NPC.
a Changes in gene expression for the indicated five immune signatures (pDC, DC1, NK, FCRL4+ B and plasma cells) with significant associations with the EBV infection status (95 positive vs 14 negative, detected by in situ hydridization with the EBV-encoded small RNAs) in NPC Cohort A. The box plot center corresponds to the median, with the box and whiskers corresponding to the interquartile range and 1.5× interquartile range, respectively. P values were based on the Wilcoxon rank-sum test. b Density dot plot and Pearson’s correlation analysis (r) of the gene expression for the DC1 signature and EBV DNA level in the NPC Cohort B (n = 128). c Bar plot showing the direction and statistical significance (P values were based on the Spearman correlation test) of the association between each of the immune cell subtypes and the number of mutations in NPC Cohort A. Significant associations are shown for the immune signatures DC1 and FCRL4+ B, GC B and plasma cells, which were positively correlated with the mutational burden. d Kaplan–Meier survival curves for progression-free survival in the 88 patients in NPC Cohort A stratified according to high vs low expression of six immune signatures (macrophage, pDC, DC1, NK cell, and plasma cell). Cox regression HRs and 95% CIs obtained after correcting for age, sex, smoking history and disease stage are shown; the corresponding Cox regression P values are also shown. e Prognostic values of immune signatures in the 88 patients in NPC Cohort A. Forest plots show HRs (blue/red squares) and CIs (horizontal ranges) derived from Cox regression survival analyses for progression-free survival in multivariable analyses adjusted for age, sex, smoking history and disease stage; the corresponding Cox regression P values are also shown. Significant results are indicated by red squares.

