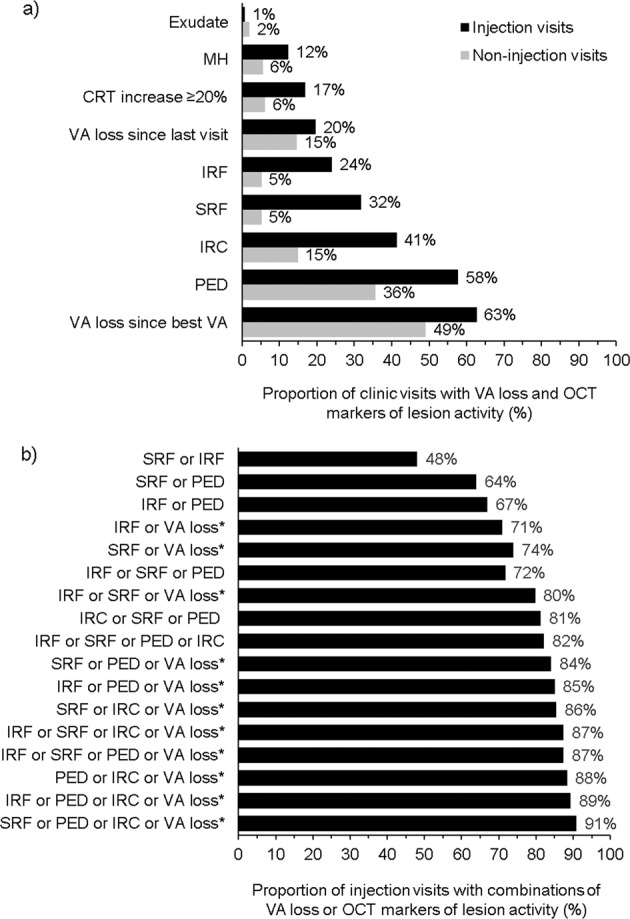
Fig. 4. Bar graph showing proportions of visits with OCT markers of lesion activity and VA loss since last visit or since best VA at injection (black bars; N = 421) and non-injection (grey bars; N = 308) clinic visits in order of frequency.

Exudate was the least frequently recorded OCT marker of lesion activity, accounting for fewer than 2% of both injection and non-injection visits. VA loss of >5 ETDRS letters since best VA was most frequent at injection visits (panel a). The occurence of combinations of these features observed at injection visits is presented in panel b. The asterisk symbol indicates the VA loss of >5 ETDRS letters since best VA. CRT central retinal thickness, IRC intraretinal cyst, IRF intraretinal fluid, MH macular haemorrhage, OCT optical coherence tomography, PED pigment epithelial detachment, SRF subretinal fluid, VA visual acuity.
