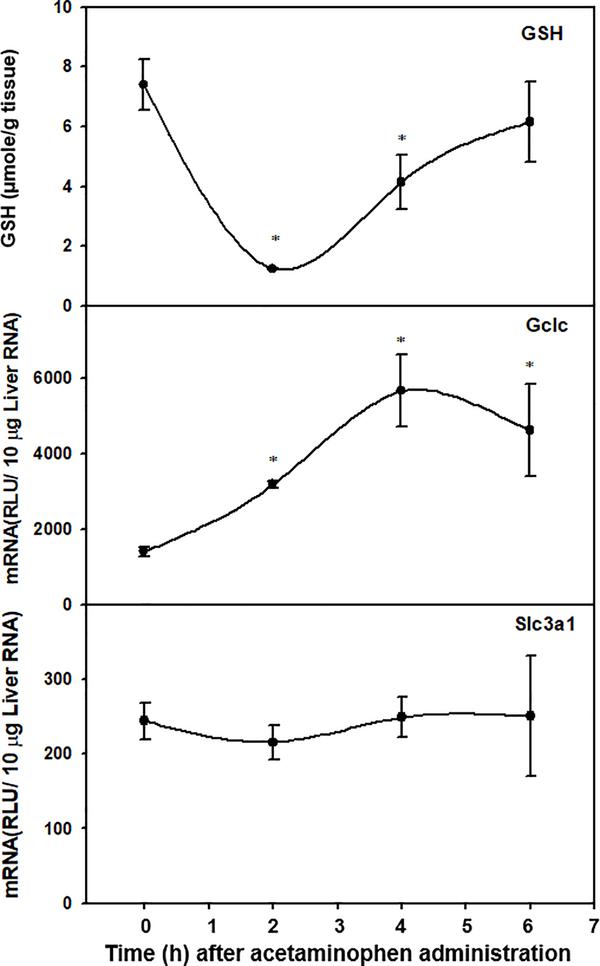
Figure. 7. Time course of hepatic GSH concentrations (top), Gclc mRNA levels (middle), and Slc3a1 mRNA levels (bottom) after treatment with acetaminophen (300mg/kg, i.p.).
GSH was extracted from liver and quantified by UPLC-MS/MS as described in the method. Total liver RNA was isolated and analyzed by the bDNA signal amplification assay for Gclc and Slc3a1 mRNA content. Data are presented as mean ± S.E.M μmol/g tissue or RLU ± S.E.M. (n=5) Asterisks indicate statistically significant different to control group (p<0.05).

