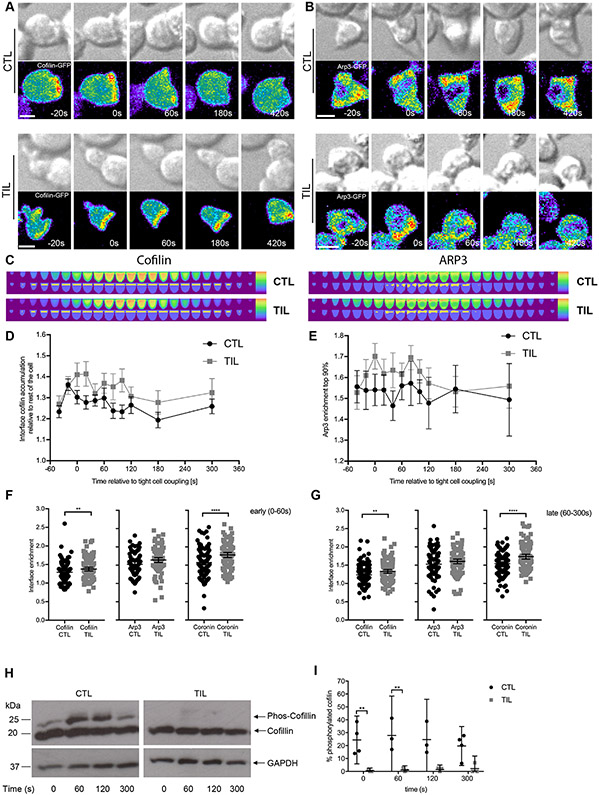
Fig. 4. Cofilin and coronin, but not Arp2/3, are more extensively enriched at the cell contact interface in TILs.
(A to G) Microscopy analysis of cofilin-GFP–expressing (A) or Arp3-GFP–expressing (B) HA-specific CTLs and TILs interacting with Renca+HA cells over time. DIC (top) and false-colored fluorescence intensity (bottom) images are representative of at least two independent experiments. (C) Computational analysis of GFP fluorescence distribution is displayed in horizontal slices perpendicular to the immune synapse averaged over all cells and time points with the interface region cylinder (cofilin) and the 10% of the cell volume with the most intense Arp3 accumulation highlighted. (D to G) Quantification of interface GFP enrichment at individual times (D and E) and at early (F) and late (G) times in the highlighted volumes are means ± 95% confidence interval of 90 CTLs and 58 TILs (D) or 56 CTLs and 51 TILs (E ) from all experiments with the addition of coronin 1A data (fig. S4, D to G) in (F) and (G). (H and I) Western blotting analysis of phosphorylated cofilin (Phos-Cofilin) in the lysates of HA-specific CTLs and TILs after activation with antibodies against CD3 for the indicated times. Blots (H) are representative of at least three independent experiments (see also fig. S5A). (I) The relative amounts of Phos-Cofilin are expressed as a percentage of that of total cofilin and are means ± 95% confidence interval as normalized to the abundance of GAPDH from all experiments. Scale bars, 5 μm. *P < 0.05, **P < 0.01, and ****P < 0.0001 by Student’s t-test (D to G) or two-way ANOVA (I).

