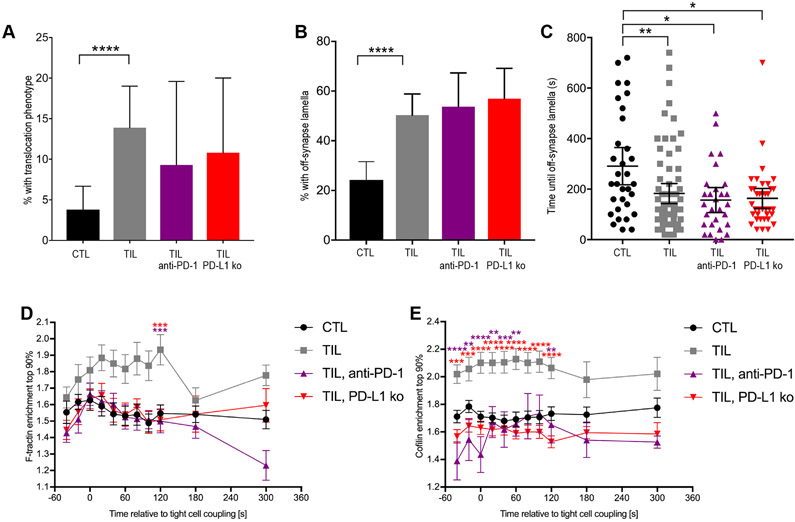
Fig. 8. Loss of PD-1 engagement in vivo partially rescues cytoskeletal polarization.
(A) Fluorescence microscopy analysis of F-tractin-GFP–expressing HA-specific CTLs and TILs from the indicated mice interacting with Renca+HA cells. Data showing the accumulation of F-actin at the center of the immune synapse are means ± SEM of 60 CTLs, 51 TILs (from Fig. 3D), 42 TILs from mice treated with antibody against PD-1, and 43 TILs from RencaHA PD-L1−/− tumors from two independent experiments. (B to D) Fluorescence microscopy analysis of cofilin-GFP–expressing HA-specific CTLs and TILs from the indicated mice interacting with HA peptide–pulsed Renca+HA cells. Data showing the accumulation of cofilin-GFP at the interface at individual time points (B) and at early (C) and late (D) times are means ± SEM (B) or are means ± 95% confidence interval (C and D) of 90 CTLs, 58 TILs (from Fig. 4D), 32 TILs from mice treated with antibody against PD-1, and 55 TILs from RencaHA PD-L1−/− tumors from at least two independent experiments. *P < 0.05, **P < 0.01 (D), **P < 0.0045 (A, to account for Bonferroni correction) by one-way ANOVA.

