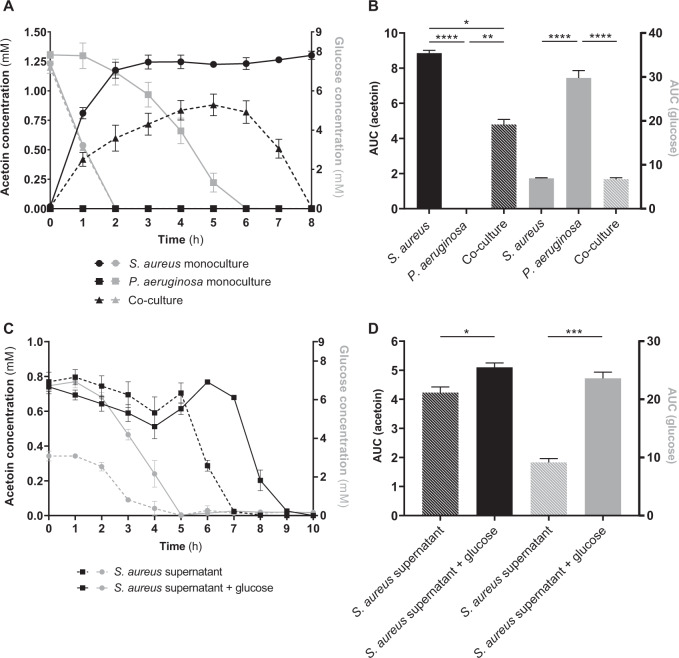
Fig. 3. Acetoin and glucose concentrations in S. aureus and P. aeruginosa cultures during coexisting interaction.
a, b S. aureus SA2599 and P. aeruginosa PA2600 were cultivated in monoculture or co-culture. Acetoin (black) and glucose (grey) were quantified from the supernatant each hour. A Points represent the mean acetoin or glucose concentration ± SEM from three independent experiments. b Bars represent the mean area under the curves presented in a + SEM. *Padj < 0.05, **Padj < 0.01 and ****Padj < 0.0001 ANOVA with Tukey’s correction. Similar acetoin accumulation results are shown in Supplementary Fig. S5 for couples 146 and 153A. c, d A filtered supernatant of S. aureus SA2599 was inoculated with P. aeruginosa PA2600 culture or sterile medium for controls. The supernatant was used unaltered (dotted lines) or complemented with glucose (solid lines). Acetoin (black) and glucose (grey) were quantified from the supernatant each hour. c Points represent the mean acetoin or glucose concentration ± SEM from three independent experiments. d Bars represent the mean area under the curves presented in c + SEM. *P < 0.05 and ***P < 0.001 Student’s t test. Similar results of acetoin catabolism are shown in Supplementary Fig. S5 for couples 146 and 153A.

