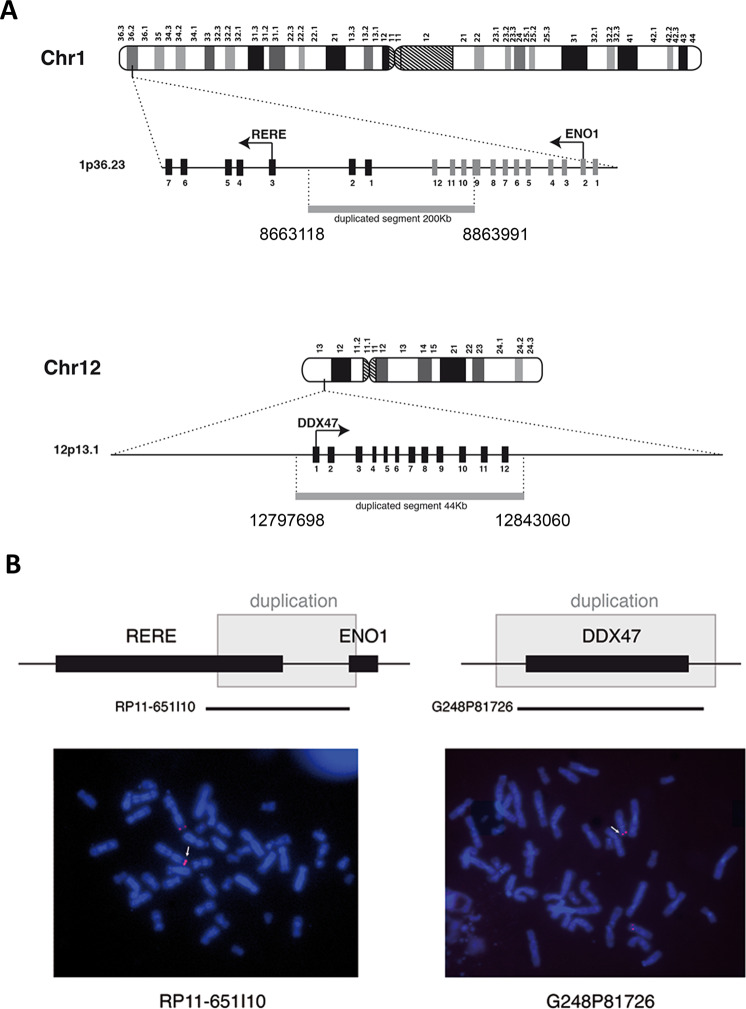
Fig. 2. Genomic location and size of the duplications.
a Schematic representation of the genomic duplications identified in the patient on chromosomes 1 and 12, following human genome build 38 (GRCh38). Gray bars show the duplicated regions, based on the first and the last duplicated oligonucleotides on the CGH array. Exons are represented as black or gray boxes and an arrow indicates the position of the translation initiation codon and the orientation of transcription. b Fluorescent in situ hybridization performed on metaphases of the patient with probes RP11-651L10 (BAC clone on chromosome 1) and G248P81726 (fosmid clone on chromosome 12), both spanning the duplicated regions. These probes appear as red signals and white arrows show the duplicated chromosomes.

