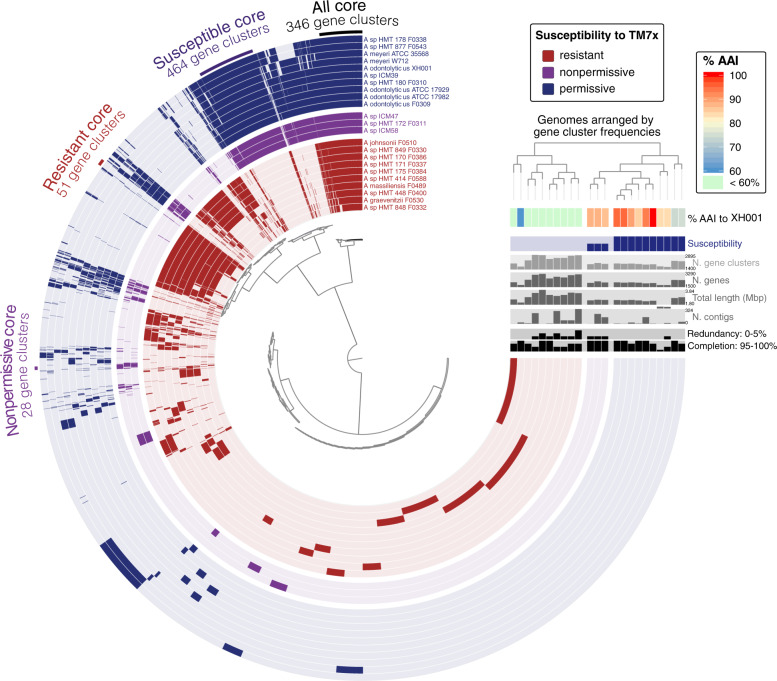
Fig. 5. Pangenome of the experimentally tested Actinomyces strains.
The central, radial dendrogram arranges each of 12,372 unique gene clusters (groups of putatively homologous genes) according to their presence/absence across genomes. Each concentric 270˚ layer represents a different genome, colored according to TM7x susceptibility, and is filled or left unfilled to mark which gene clusters are found in each genome. Layers are arranged by frequency of gene clusters, displayed as a dendrogram on the top righthand side of plot. Extending off the end of the plot show bar charts reporting various statistics for each genome and a heatmap showing average amino acid identity. The heatmap is also shown in Fig. S7 in higher magnification. Sets of key gene clusters are highlighted with a labeled arc spanning gene clusters of interest.

