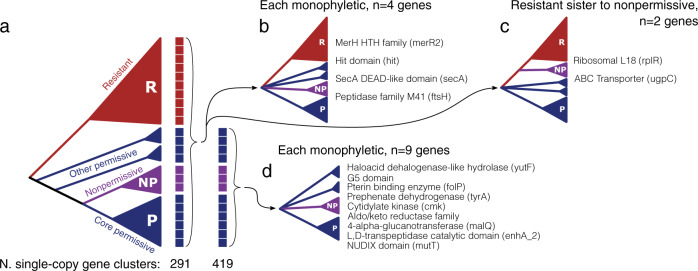
Fig. 6. Gene trees from core gene clusters reveal gene variants that correlate with TM7x susceptibility.
a Cartoon showing a simplified topology of the genome similarity dendrogram from Fig. 5, with the blue, purple, and red clades representing the permissive, nonpermissive, and resistant genomes respectively. Single-copy core gene clusters, those with only one gene sequence from each genome, core to all 23 genomes (first column of boxes, 291 gene clusters) and core to susceptible genomes (second column of boxes, 419 genes) were identified. For each gene cluster a phylogenetic tree was created and compared against three topologies of interest; gene clusters core to all genomes (b and c), and gene clusters core to susceptible genomes (d). Gene clusters core to all genomes could reveal each observed clade to be monophyletic with variable relationships (b) or place resistant sequences sister to those from nonpermissive hosts (c). The number over each arrow reports the number of gene clusters producing the illustrated topology. Polytomies represent either real polytomies or an unspecified hierarchy that preserves the monophyly of the illustrated clades. The text lists the predicted Pfam functions for each gene cluster.

