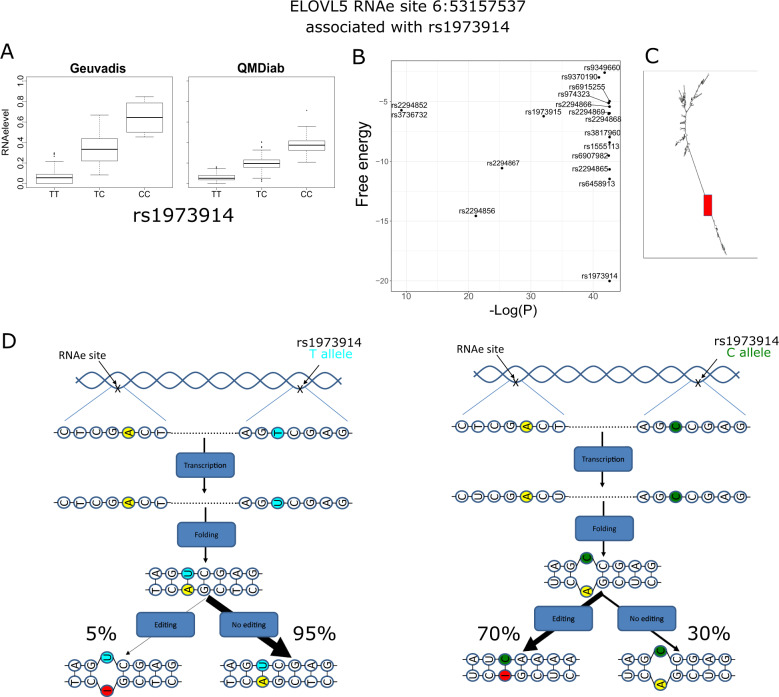
Fig. 3. Effect of the RNAe-QTL on the RNA secondary structure. Three other cases are provided in Fig S4–S6.
a Boxplot showing the significant association of SNP rs1973914 with the RNAe level of the RNAe site chr6:53157537 in Geuvadis and QMDiab. b Distribution of the RNAe/associated SNPs pairwise alignment estimated free energy as function of -log P-value of RNAe level/SNP association. The strongest association (rs1973914) shows the alignment with the lowest estimated free energy. c The complete RNA predicted secondary structure. The red rectangle indicates the localization of the hairpin carrying the RNAe and the RNAe-QTL on opposite strand. d Cartoon representation of the RNAe and the associated RNAe-QTL. All the four possible cases are represented for both alleles (T and C) of the RNAe-QTL rs1973914 in a nonedited and edited RNA. Colored in yellow and red is the RNAe site in nonedited and edited RNA, respectively. Colored in green is the C allele of rs1973914 and in magenta is the T allele.

