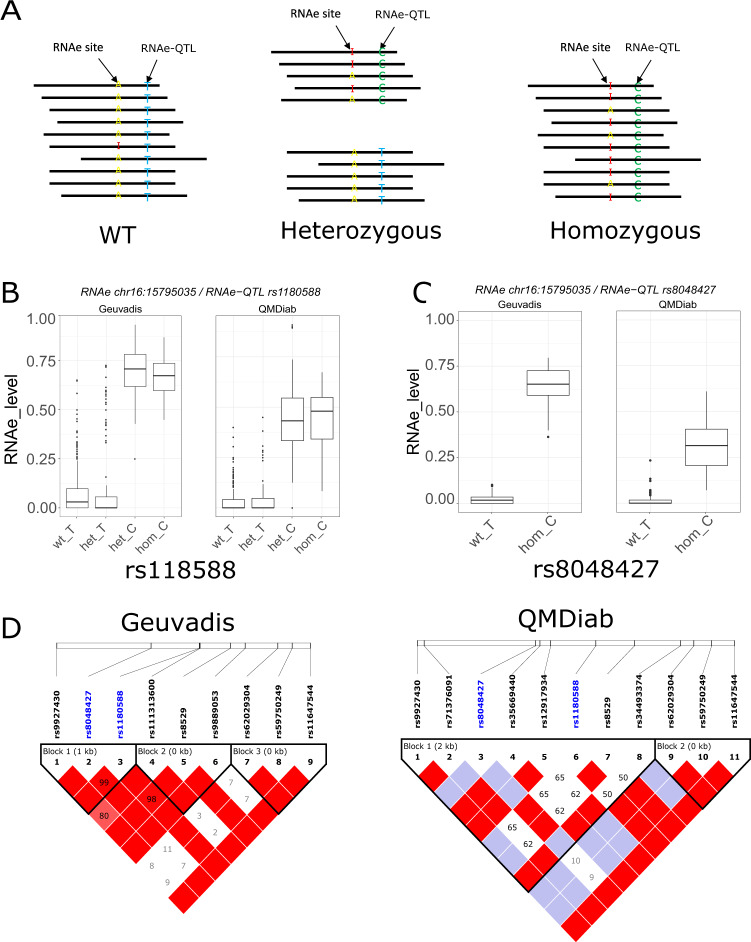
Fig. 4. Allele specific RNA editing (ASE).
a Schematic diagram of ASE. Pairs of RNAe sites and associated RNAe-QTL falling on the same reads offer the opportunity to compute ASE on heterozygous. b ASE level (RNAe displaying RNAe-QTL allele-specificity) for the association RNAe site chr16:15795035 and the ANP rs1180588 showing a similar ASE level for the reference allele (T) in wild type homozygous (wt_T) and heterozygous genotypes (het_T), and a similar ASE level associated with the alternative allele (c) in homozygous for the alternative allele (hom_C) and heterozygous genotypes (het_C) in Geuvadis (left) and in QMDiab replication (right). In this case, both RNAe site and the associated SNP (rs1180588) are close enough to be on the same reads. C. ASE level for the strongest association with the RNAe site chr16:15795035; rs8048427. The RNAe site and the RNAe-QTL were too distant to fall on the same reads. Represented here are only ASE level for reference allele in homozygous wild type (T) and ASE level for the alternative allele for homozygous for the alternative allele (c). d Linkage disequilibrium plot for the region covering the two RNAe-QTL rs1180588 and rs8048427. The value within each diamond represents the pairwise correlation between SNPs defined by the upper left and the upper right sides of the diamond. Shading represents the magnitude and significance of pairwise LD, with a red-to-white gradient reflecting higher to lower LD values. In both datasets, the two RNAe-QTL (colored in blue) belong to the same LD block suggesting that these two RNAe-QTLs represent a single signal.

