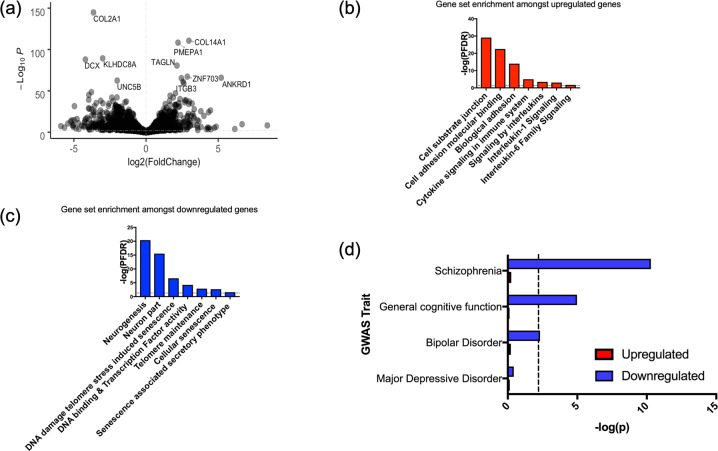
Fig. 5. Differentially expressed genes in serially passaged cells relative to cells at baseline, and gene sets implicated in cell ageing.
a A volcano plot summarising the RNA-sequencing results, where log2(Fold change) is shown on the x-axis, and the strength of the association given by −Log10(P), is shown on the y-axis. b Examples of gene sets which significantly overlap with the upregulated genes in our cell model. All gene sets represent those which surpassed a false discovery rate correction, PFDR < 0.05, in our enrichment analysis, as marked by the dashed line. c Examples of gene sets which significantly overlap with the downregulated genes in our cell model. d A bar plot showing the genetic overlap between various traits as assayed by GWAS (y-axis) and genes either upregulated or downregulated in association with cell ageing. The strength of the association is shown on the y-axis (−log(p)). The dashed line represents the threshold of significance (corrected for the number of tests).

