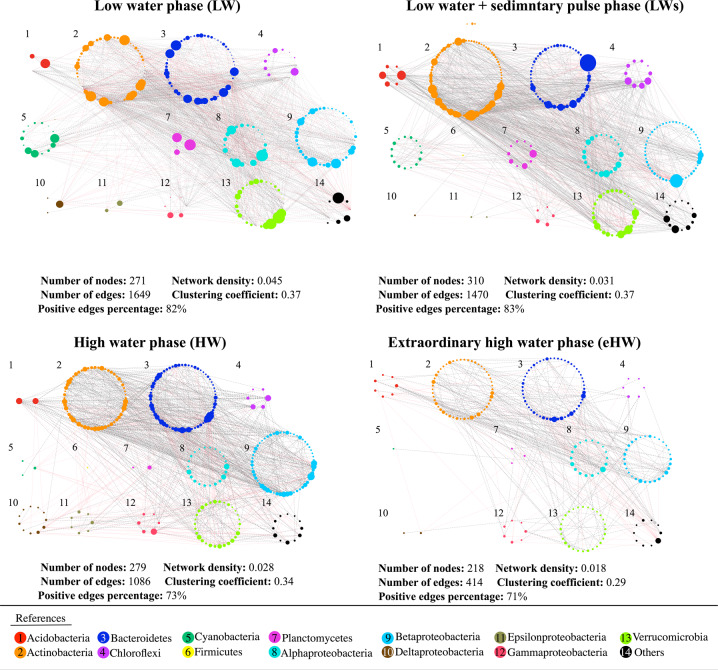
Fig. 5. Bacterial co-occurrence networks for each hydrological phase of the Paraná fluvial system, arranged according to the bacterial taxonomy (classes or orders).
The size of each node is proportional to the number of connections (degree). Gray dashed and red solids lines represent positive and negative correlation, respectively. The number of nodes, number of edges, positive edges percentage, network density, and clustering coefficient of the overall network is indicated below each network.

