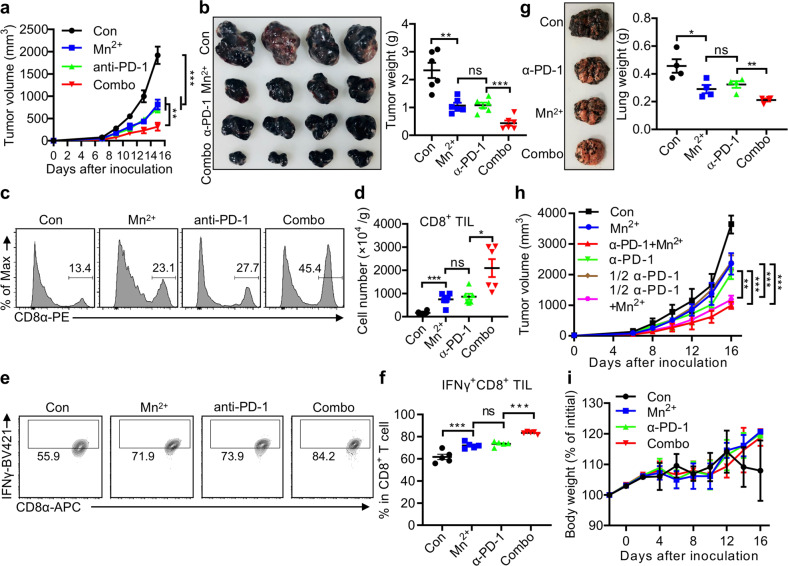
Fig. 6. Mn2+ boosts antitumor immunotherapy in mice.
a Tumor sizes of subcutaneous B16F10 implants in mice treated with the isotype antibody (200 μg/mouse i.p.), MnCl2 (5 mg/kg i.n.), anti-PD-1 antibody (200 μg/mouse i.p.) or MnCl2 plus anti-PD-1 antibody (n = 6 per group. Combo, combined treatment with MnCl2 and anti-PD-1 antibody). b Representative image (left), tumor weights (right) of subcutaneous B16F10 implants in mice as in a. c, d Representative FACS figures (c) and quantification (d) of tumor infiltrating CD8+ T cells of mice as in a. e, f Representative FACS figures (e) and quantification (f) of IFNγ+CD8+ TILs of mice as in a. g Representative image (left) and quantification (right) of tumor nodules and lung weights of saline or 5 mg/kg MnCl2 treated mice (i.n., n = 4 per group) at day 15 after intravenous injection of 2 × 10⁵ B16F10 cells. h Tumor sizes of subcutaneous B16F10 implants in mice treated with isotype antibody (200 μg/mouse i.p.), MnCl2 (5 mg/kg i.p.), anti-PD-1 (200 μg/mouse i.p.), 1/2 anti-PD-1 (100 μg/mouse i.p.), or 1/2 anti-PD-1 plus MnCl2 (n = 5 per group). i Body weight changes were followed for 16 days after subcutaneous B16F10 implants in mice treated with MnCl2 (5 mg/kg i.p.), anti-PD-1 antibody (200 μg/mouse i.p.), or MnCl2 plus anti-PD-1 antibody (n = 5 per group). Data represent analyses of the indicated n mice per group, means ± SEM. Data from cells and mice are representative of three independent experiments. ns, not significant, P > 0.05; *P < 0.05; **P < 0.01; ***P < 0.001.

