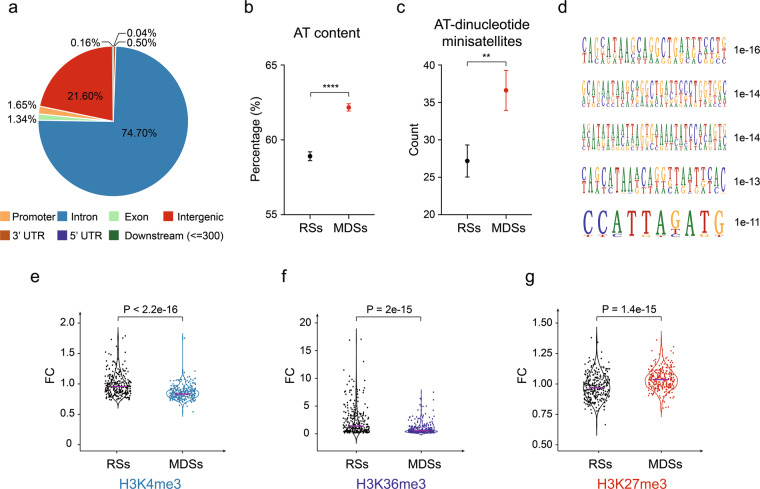
Fig. 4. MDSs are enriched in AT-dinucleotide minisatellites and transcription repressive chromatin marks.
a Distribution of MDSs across the genetic elements. b Overall AT content in MDSs and RSs. Data are shown as means ± SEM, ****P < 0.0001 calculated by Student’s t-test. c The number of AT-dinucleotide minisatellites in MDSs and RSs. Data are shown as means ± SEM, **P < 0.01 calculated by Student’s t-test. d Five most significant sequence motifs identified in MDSs. Numbers at the right are P values indicating statistical significance. e–g Violin plots comparing the levels of H3K4me3, H3K36me3, and H3K27me3, respectively. P value was determined using the Wilcoxon rank-sum test. The solid purple line indicates the median value.

