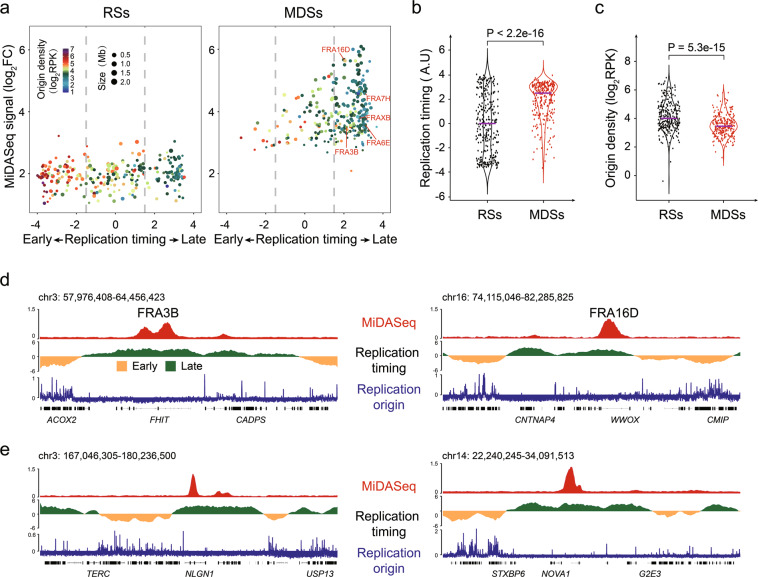
Fig. 5. Replication origin paucity and late replication timing are prevalent in MDSs.
a Volcano plot displaying the characteristics of each RS (left) or MDS (right). The replication origin density and the size of each site are indicated by dot color and size, respectively. b, c Quantitative comparison of the replication timing and replication origin density between MDSs and RSs. P values were determined by Wilcoxon rank-sum test. The solid purple line indicates the median value. d Genomic view of the MiDASeq, replication timing and replication origin density at representative known CFSs including FRA3B and FRA16D. Yellow and green peaks in the track of replication timing indicate early-replicating and late-replicating regions. e Genomic view of the same parameters as in d at two MDSs residing in unreported loci.

