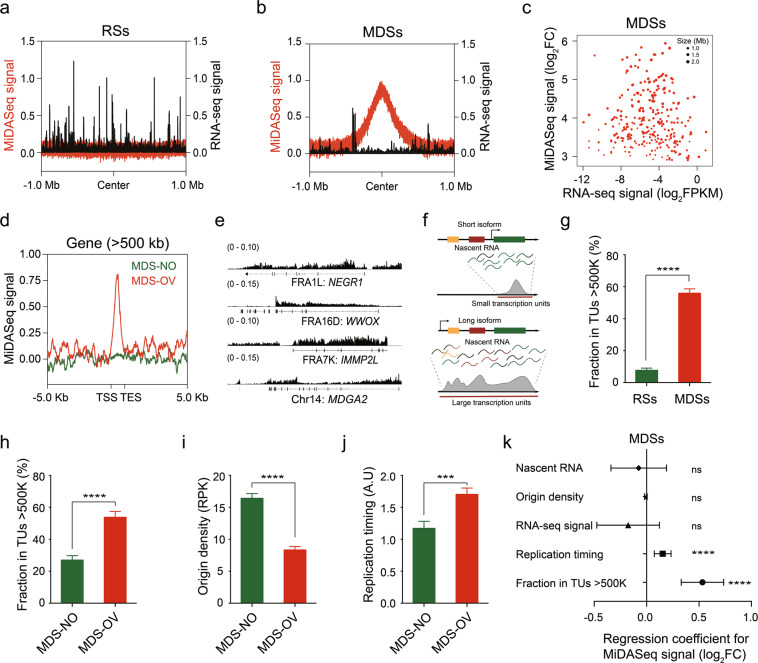
Fig. 6. Large transcription units and late replication timing, but not transcription level, is the major contributor to MDS formation.
a, b Aggregation plots of the distribution of the MiDASeq signal (red) and RNA-seq signal (dark) over RSs (a) or MDSs (b) in a 2 Mb window centered around the midst of RSs or MDSs. c Scatter plot displaying the MiDASeq signal and RNA-seq signal of every MDS. d Aggregation plots of the MiDASeq signal distribution across the gene bodies of MDS-OV or MDS-NO genes > 500 kb. e Representative view of nascent RNA signal at three MDSs mapped to known CFSs and one MDS residing in unreported genomic loci. f Schematic diagram of transcription of short and long isoforms of large genes, and definition of TUs. g Fraction of RSs and MDSs in large TUs > 500 kb. Data are shown as means ± SEM, ****P < 0.0001 calculated using a Wilcoxon rank-sum test. h Fraction of MDS-NO and MDS-OV genes > 500 kb in large TUs > 500 kb. Data are shown as means ± SEM, ****P < 0.0001 calculated using a Wilcoxon rank-sum test. i Quantitative comparison of origin density between MDS-OV and MDS-NO genes > 500 kb. Data are shown as means ± SEM, ****P < 0.0001 calculated using a Wilcoxon rank-sum test. j Quantitative comparison of replication timing between MDS-OV and MDS-NO genes > 500 kb. Data are shown as means ± SEM, ***P < 0.001 calculated using the Wilcoxon rank-sum test. k Multiple regression analysis of MiDASeq signal and other characteristics including the RNA-Seq signal, nascent RNA level, origin density, replication timing, and fraction in large TUs > 500 kb. Regression coefficient and significance are indicated. Error bars indicate the confidence interval (95%, α = 0.05) of the regression coefficient.

