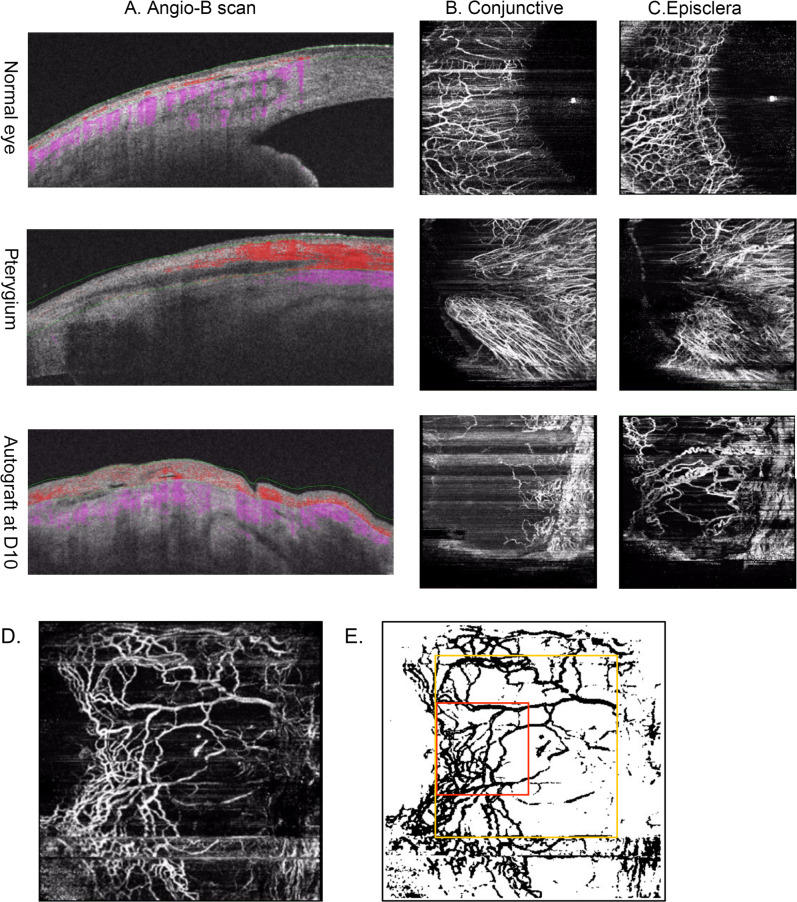
Fig. 1. Demonstration of OCTA scans on anterior segment and image processing.
Demonstration of Angio-B scan (a), conjunctival (b), and episcleral (c) vasculature in the nasal quadrant of normal conjunctiva, pterygium and autograft area and demonstration of processing scans and defining regions of interest. An episcleral scan was adjusted to the best contrast (d) and blood vessels were binarized (e). A 224 × 224 pixels square at 3 o’clock perpendicular to the corneal limbus was analysed for episcleral vessel density (yellow frame) and a 112 × 112 pixels square at 3 o’clock perpendicular to the corneal limbus was analysed for MCA density (red frame).

