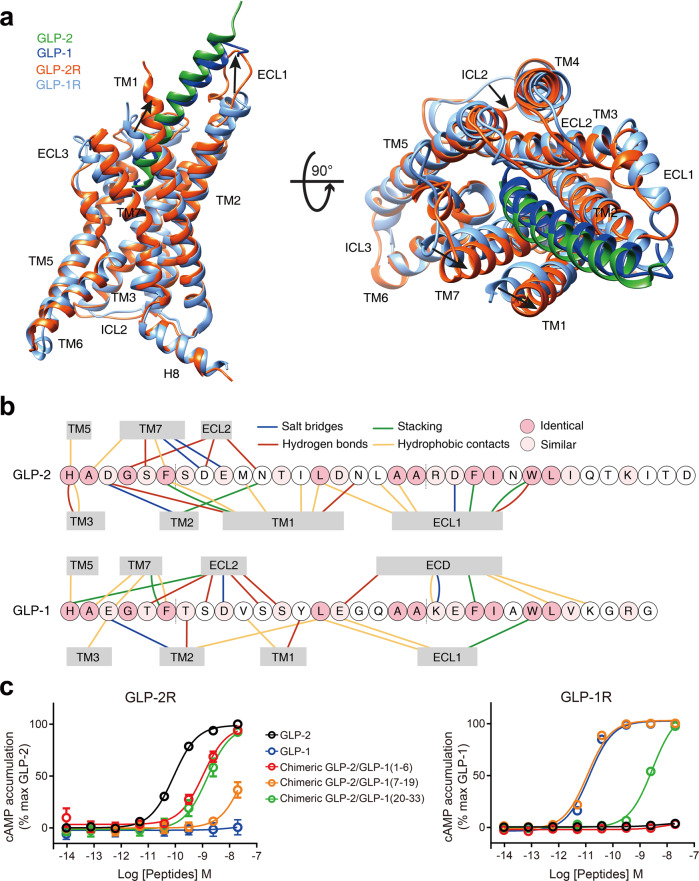
Fig. 4. Basis of ligand specificity between GLP-2R and GLP-1R.
a Structural comparison of GLP-2–GLP-2R–Gs and GLP-1–GLP-1R–Gs.13 Receptor ECD and G protein are omitted for clarity. b Schematic diagram of interactions between peptide and receptor. Conserved residues in GLP-2 and GLP-1 are highlighted in pink, while those similar are shown in light pink. Length of gray shading box illustrates the interface area between peptide and corresponding segment. c Signaling profiles of the chimeric GLP-2/GLP-1 peptides. Replacement of the N-terminus (residues 1–6), middle region (residues 7–19) and C-terminus (residues 20–33) of GLP-2 by corresponding segment of GLP-1 was named as chimeric GLP-2/GLP-1(1–6), GLP-2/GLP-1(7–19) and GLP-2/GLP-1(20–33), respectively. Dose-response curves of peptide-induced cAMP accumulation for GLP-2R were generated and graphed as means ± SEM from three independent experiments.

