
Figure 5.
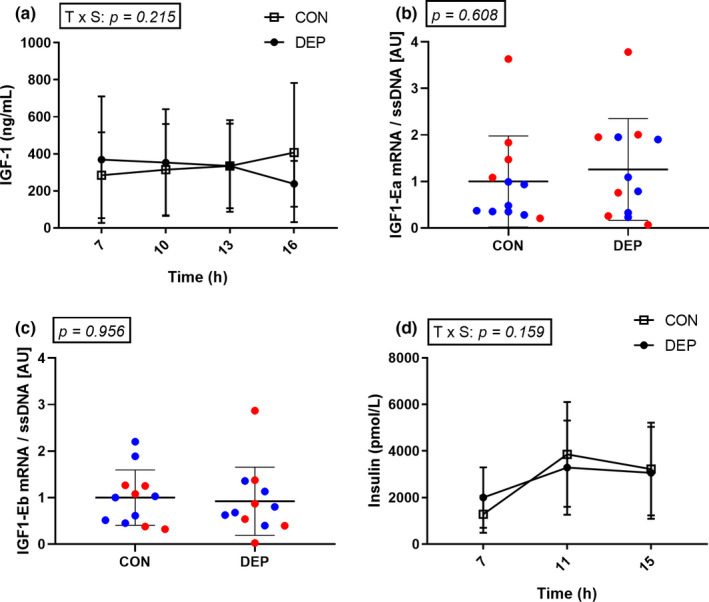
Plasma IGF‐1 concentrations in control (CON) and sleep‐deprived (DEP) conditions. N = 13. Data were analyzed using a two‐way ANOVA (a). Muscle mRNA levels of the IGF‐1 isoforms IGF1‐Ea (b) and IGF1‐Eb (c) in muscle biopsies collected at 13:00. Red dots depict male subjects. Blue dots depict female subjects. N = 13. Data were analyzed using a two‐tailed paired t test. Insulin concentrations in control (CON) and sleep‐deprived (DEP) conditions. N = 13. Data were analyzed using a two‐way ANOVA (d). All data are presented as mean ± SD