
Figure 6.
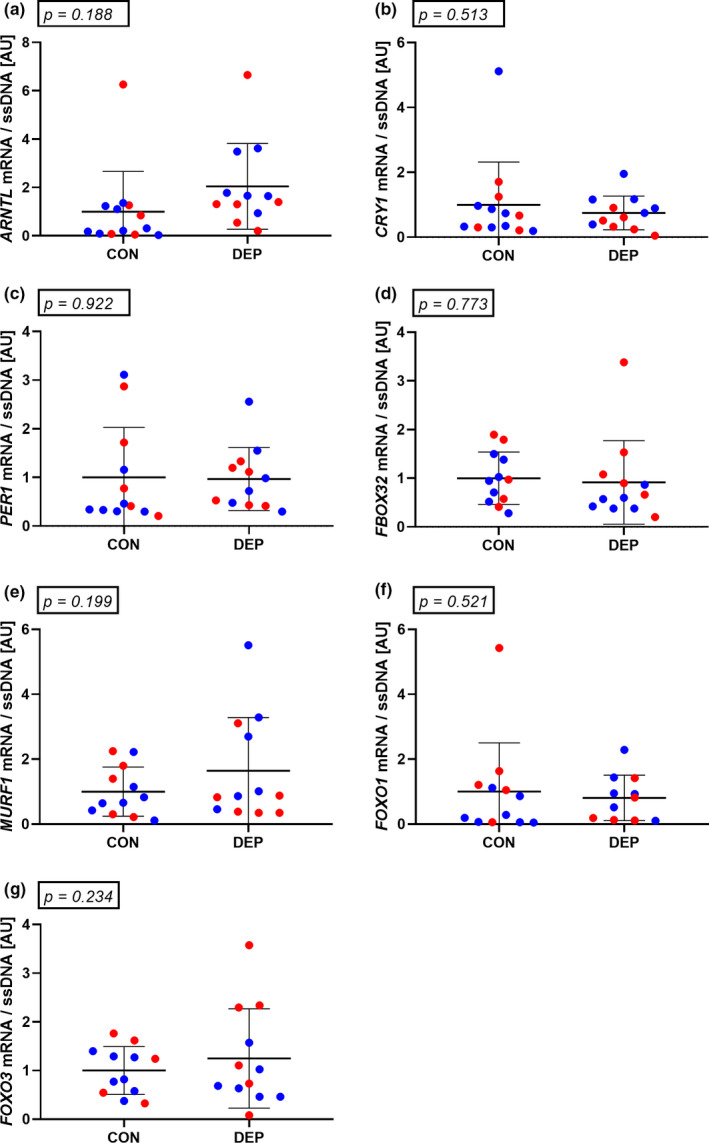
Muscle mRNA levels of ARNTL (a), CRY1 (b), PER1 (c), atrogin (FBOX32) (d), MURF1 (e), FOXO1 (f), and FOXO3 (g) in muscle biopsies collected at 13:00. Red dots depict male subjects. Blue dots depict female subjects. N = 13. Data were analyzed using a two‐tailed paired t test. All data are presented as mean ± SD