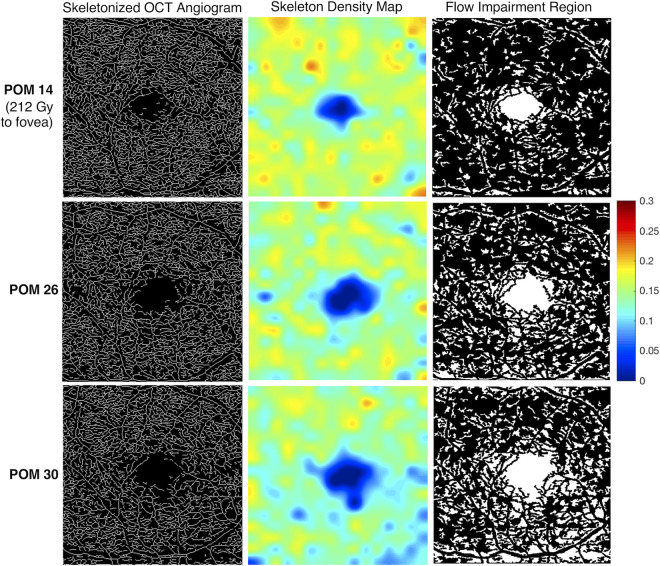
Figure 3.
Longitudinal skeleton density and flow impairment maps of a treated eye. (Case 1) A 65-year-old man received 212 Gy to the fovea (right eye), with a range of 85 Gy to 250 Gy across the standard 3 × 3-mm optical coherence tomography angiogram (OCTA). OCTAs were acquired at postoperative months (POMs) 14, 26, and 30. The visual acuity of the treated eye at these dates was 20/25, 20/25, and 20/80, respectively. The visual acuity of the fellow eye at the same time points (OCTA images not shown) was 20/25, 20/20, and 20/25, respectively. In the skeletonized image, impaired perfusion is visible inferiorly at POM 26 compared with POM 14, with worsening perfusion at POM 30 (column 1). The loss of skeleton density is more clearly visualized in the heat map (column 2). Warmer colors reflect areas of greater vessel skeleton density, with relative differences defined on the color scale. A parallel trend is seen in the flow impairment region images (column 3).

