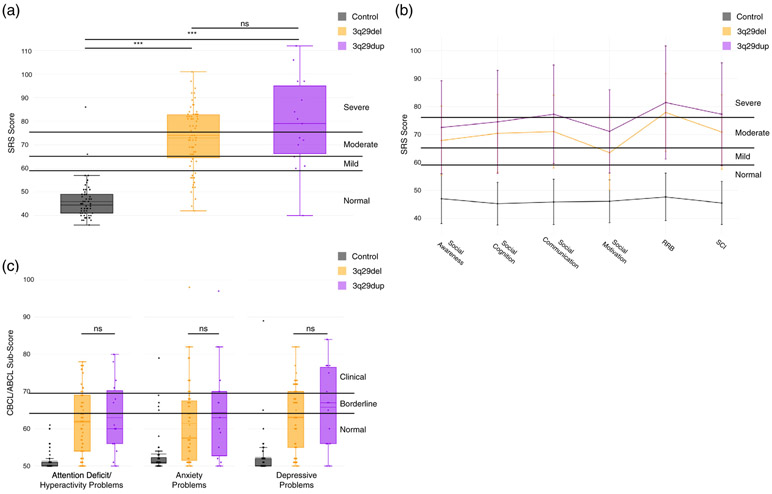
FIGURE 8.
Comparison of Social Responsiveness Scale (SRS) and Child Behavior Checklist/Adult Behavior Checklists (CBCL/ABCL) scores between 3q29dup and 3q29del. (a) Total scores on the SRS for participants with 3q29dup (n = 15), participants with 3q29del (n = 67), and controls (n = 56), showing that participants with 3q29dup and 3q29del do not score significantly differently. For each box plot, the dashed line indicates the mean value, while the solid line indicates the median. (b) SRS subscale profile for participants with 3q29dup (n = 15), participants with 3q29del (n = 67), and controls (n = 56), showing that the shape of the SRS subscale profile is conserved between participants with 3q29dup and 3q29del (Restricted Interests and Repetitive Behaviors [RRB]; Social Communication and Interaction [SCI]). (c) Profile of participants with 3q29dup (n = 15), participants with 3q29del (n = 64), and controls (n = 57) across three DSM-oriented subscales from the CBCL and ABCL, showing that participants with 3q29dup and 3q29del have similar levels of pathology in all three domains. For each box plot, the dashed line indicates the mean value, while the solid line indicates the median. ***, p < .001; n.s., not significant

